Well, I finally completed 366 days worth of data… Here is the entire year on a 2.4MB loop:
(today is the faint vertical line… Roughly -75%)

Well, I finally completed 366 days worth of data… Here is the entire year on a 2.4MB loop:
(today is the faint vertical line… Roughly -75%)
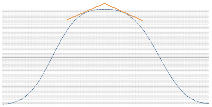
Or, the data I was really looking forward to:
This shows that for my location:
Spring & Summer changes a bit more gently… (smaller steps daily)
while Fall & Winter changes a bit more aggressively. (bigger steps daily)
Note:
I centered the mirrored images at the orange lines,

so a few days might have been cropped off the extreme right or left in the animated image above.