
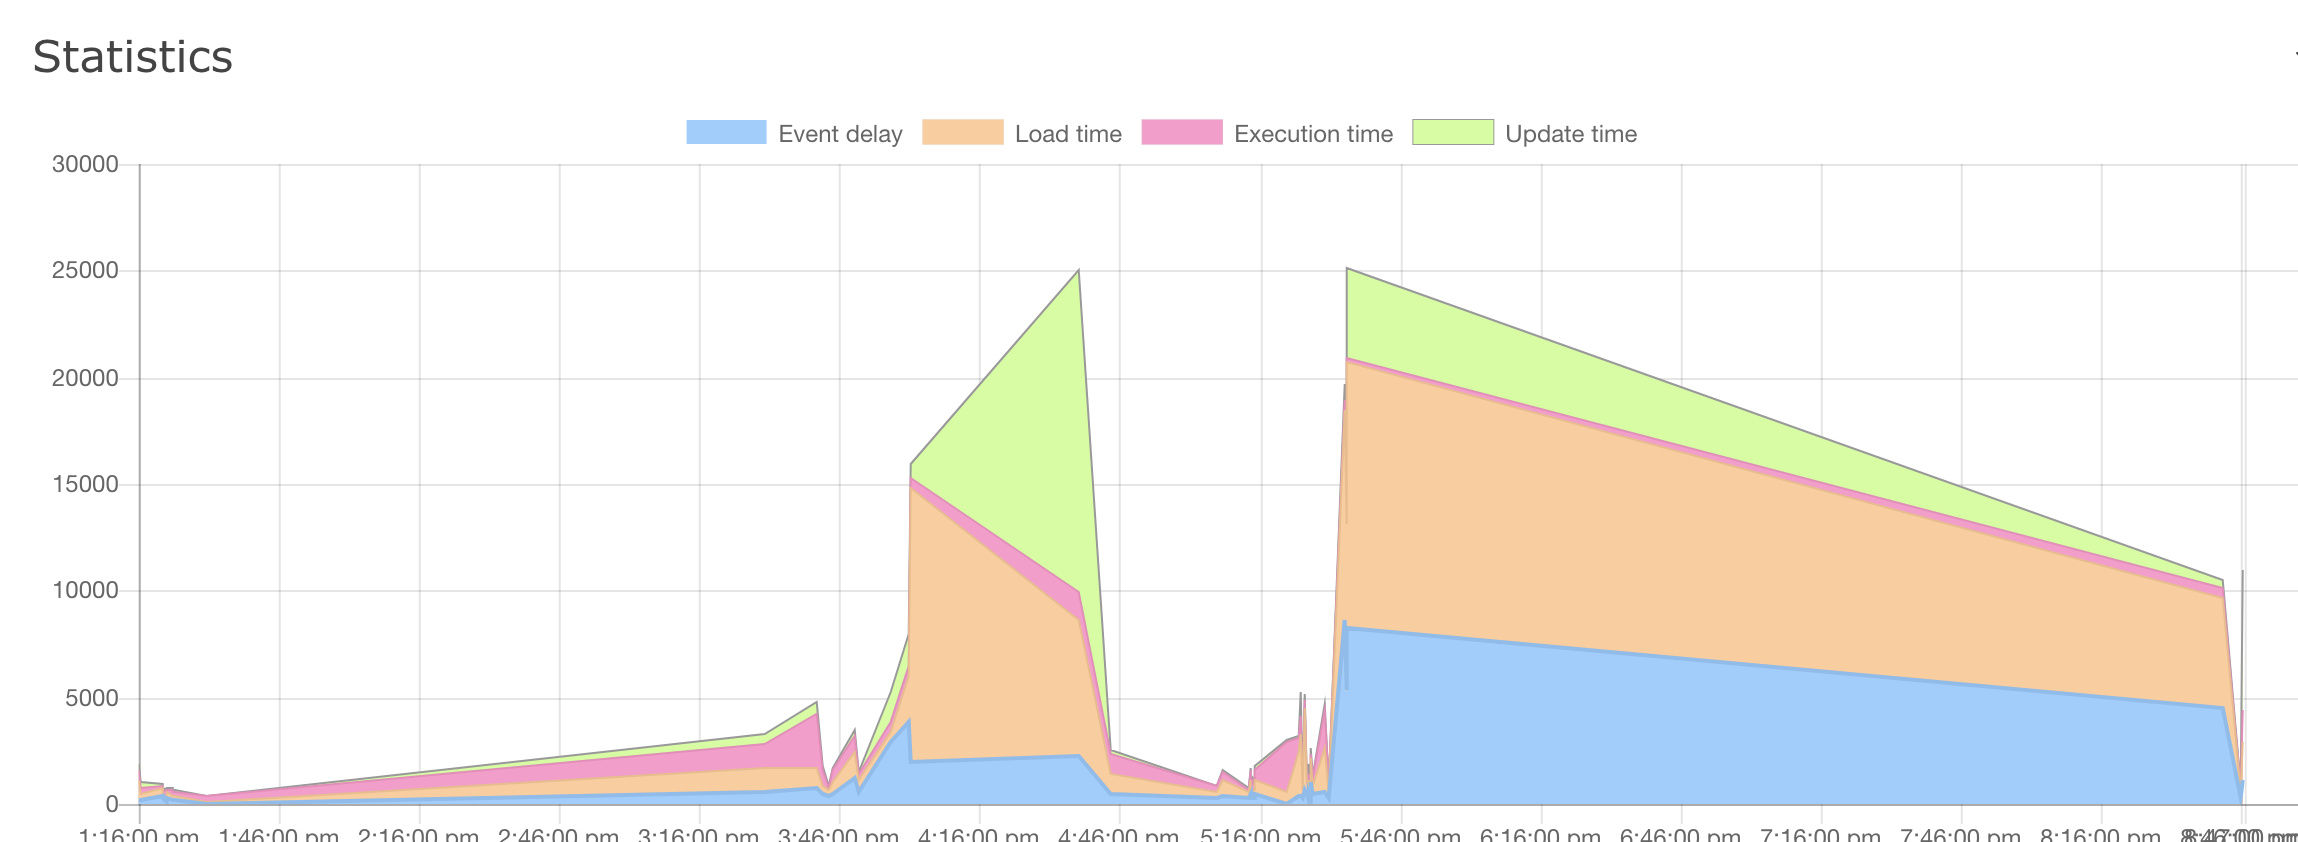
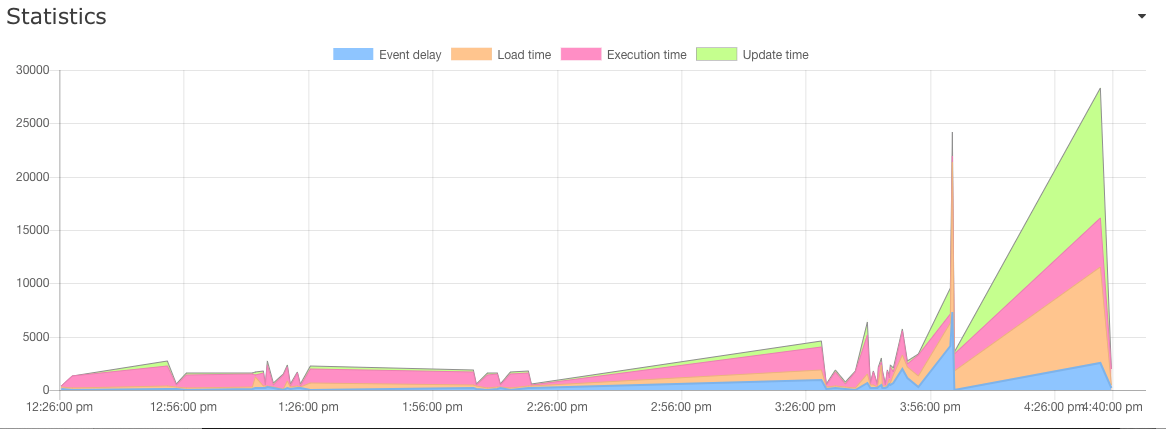
I’ve noticed graphs that look like this in several pistons lately. What could be causing it? intermittently I see very long delays in piston execution. Could this be caused by running recovery too frequently?
Long delays in piston execution

restauffer
#4
Any luck on this issue? I have the same delays on a piston and in the logs, when this happens, I see the piston running over and over always starting with “…execute = Recovery with a delay of…” This is a piston that has worked daily for almost a year so it is not something that changed in the piston itself.
ipaterson
#5
Here is another recent issue regarding piston timeouts
This is most likely a ST platform issue. Are there any pistons that exhibit this behavior 100% of the time while others continue to trigger fine? The earlier report seemed to be related to date-based triggers like “time happens daily at …”
dville
#6
My issue was resolved because the Fortrezz MIMO 2+ zwave device I was using was taking too long to acknowledge automation actions.
I created a virtual switch used ST SmartLighting local automation to have the MIMO relay mirror the status of the virtual switch and my WebCore scripts using this relay have run great ever since.
I created a virtual switch used ST SmartLighting local automation to have the MIMO relay mirror the status of the virtual switch and my WebCore scripts using this relay have run great ever since.