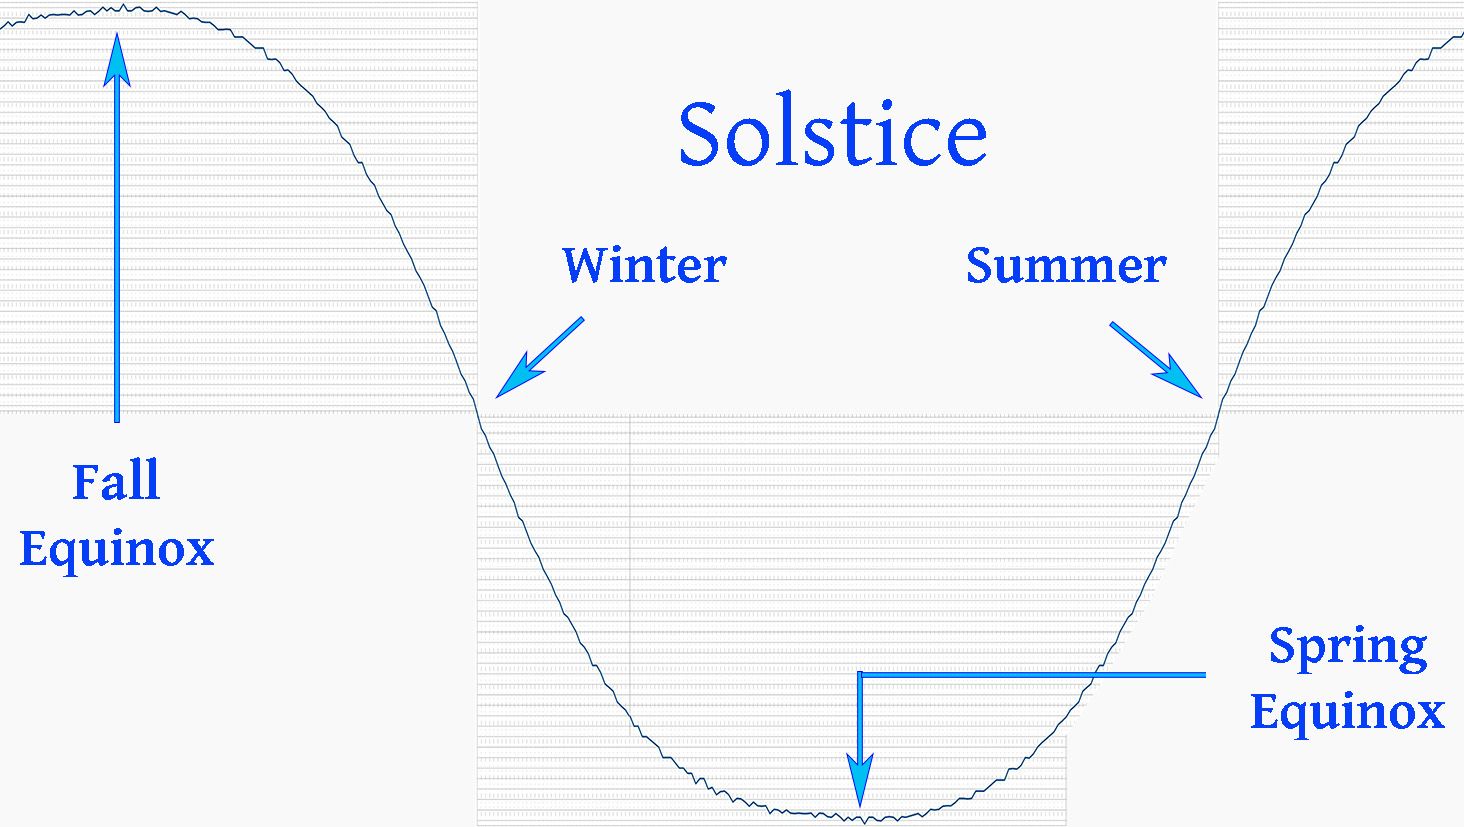
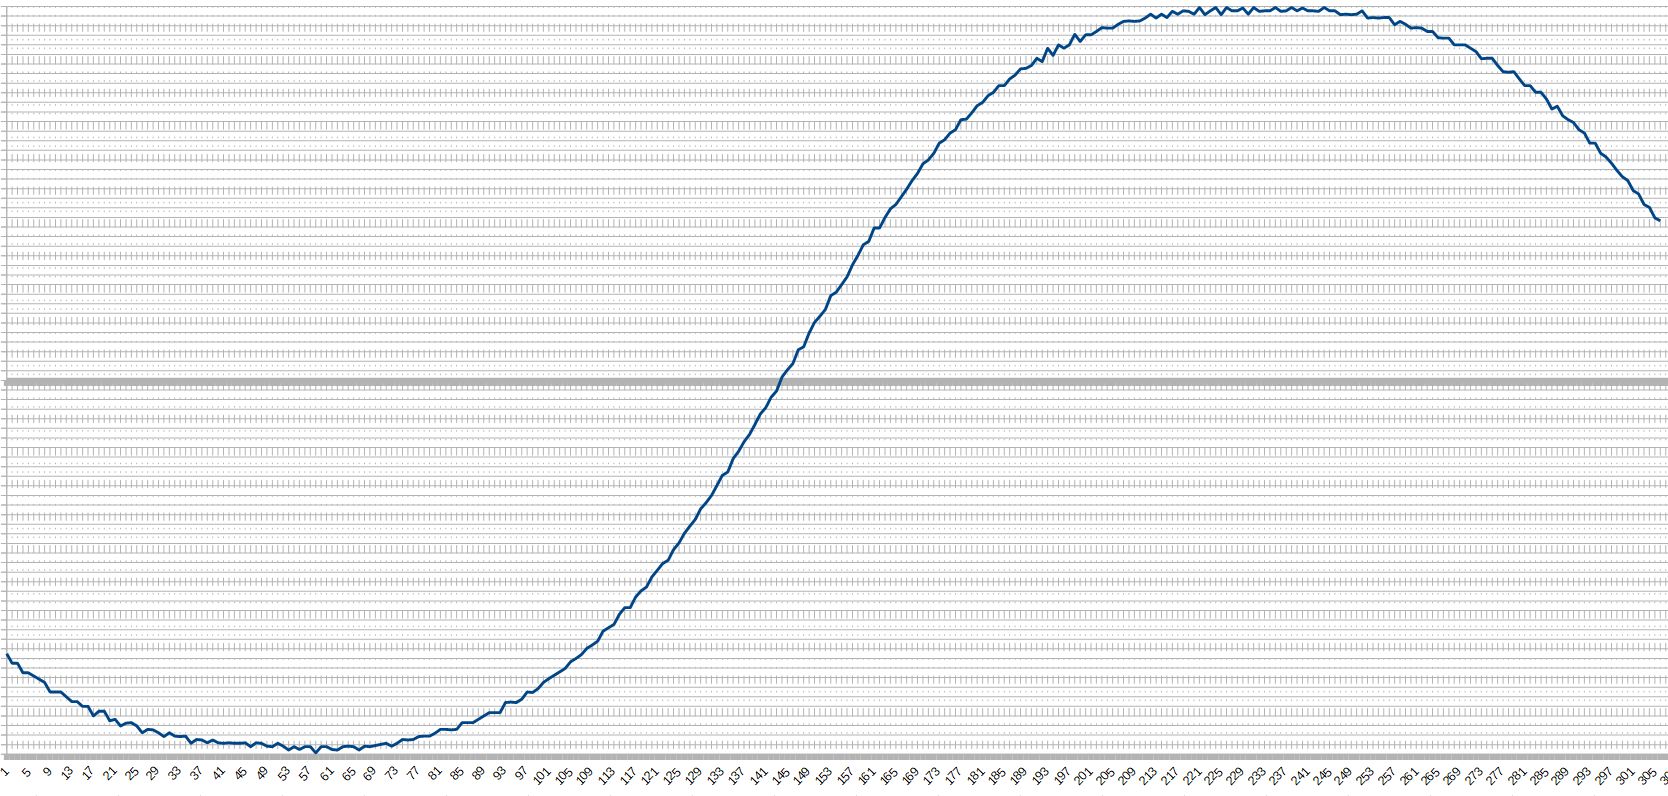
New image showing 144 days straight…
- The highest point was the Fall Equinox…
- The very last dataPoint finally dropped to zero on the Winter Solstice…
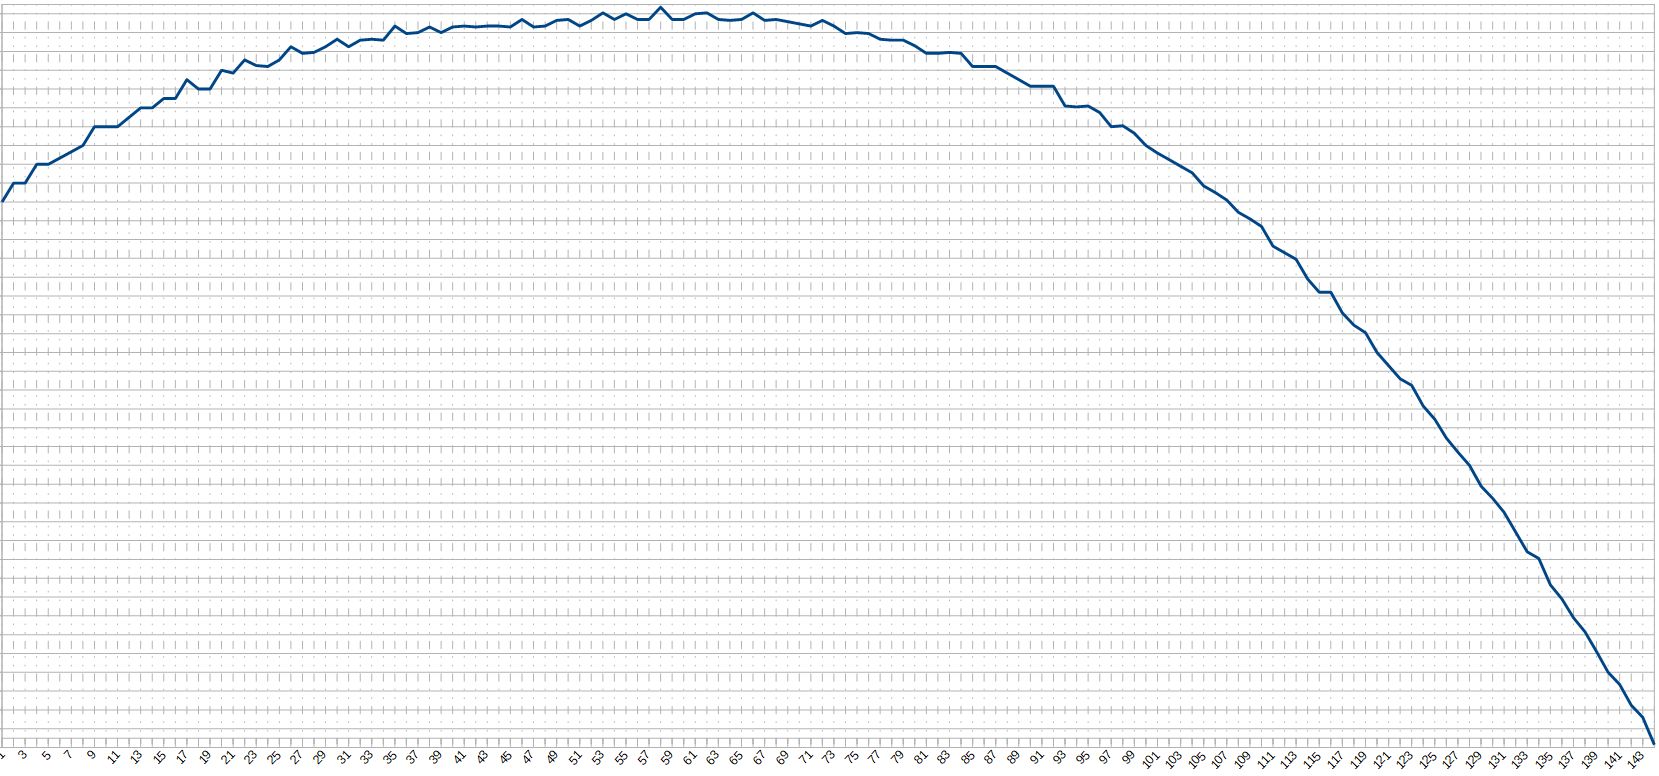
I am really looking forward to seeing the entire year graphed out this way.

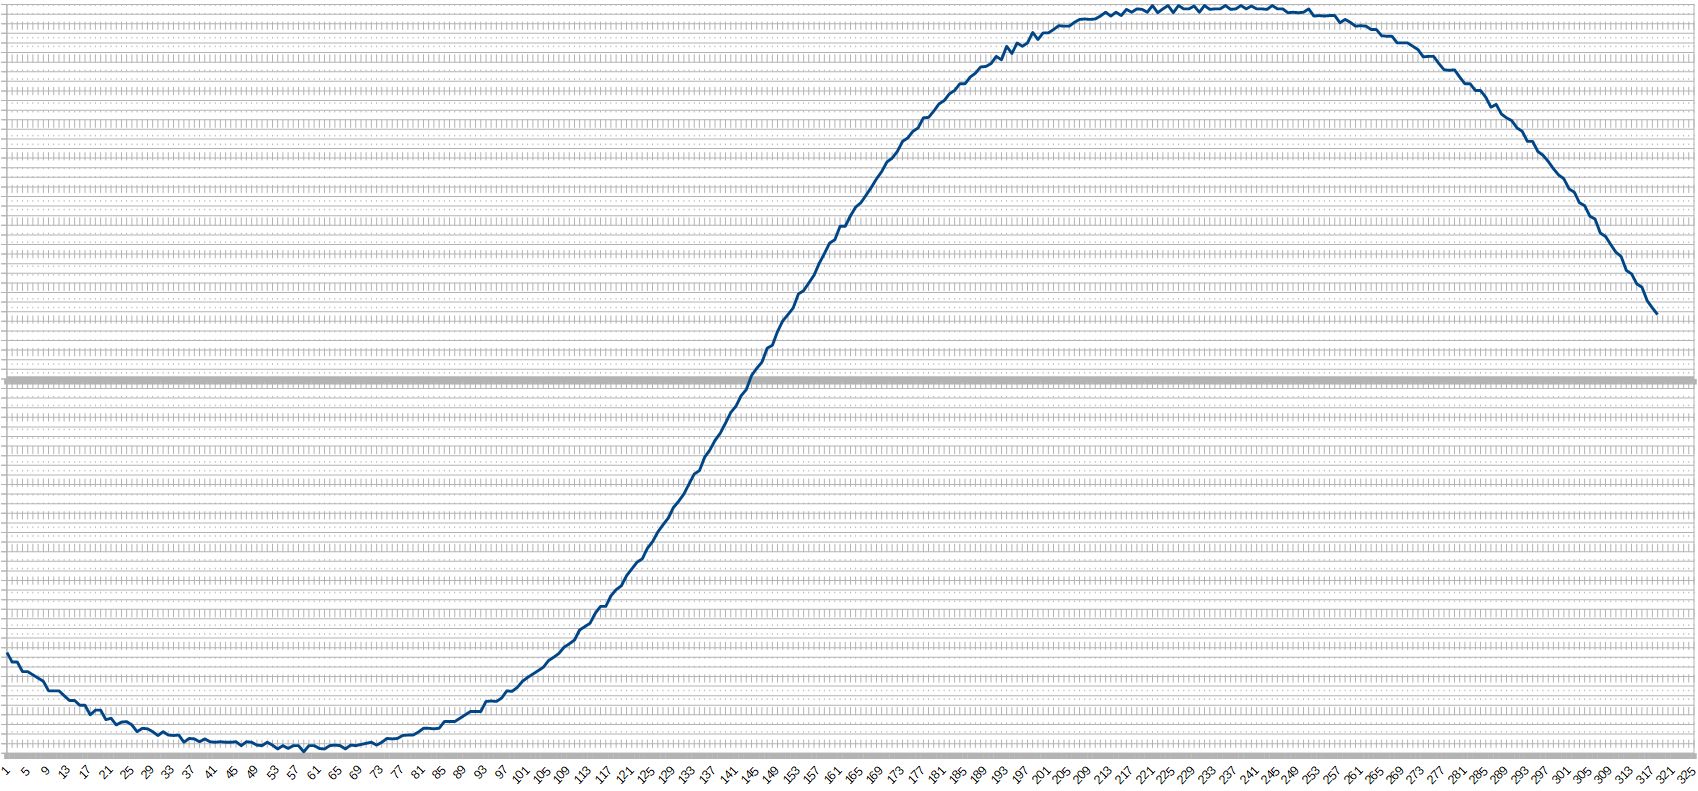
New image showing 144 days straight…
I am really looking forward to seeing the entire year graphed out this way.
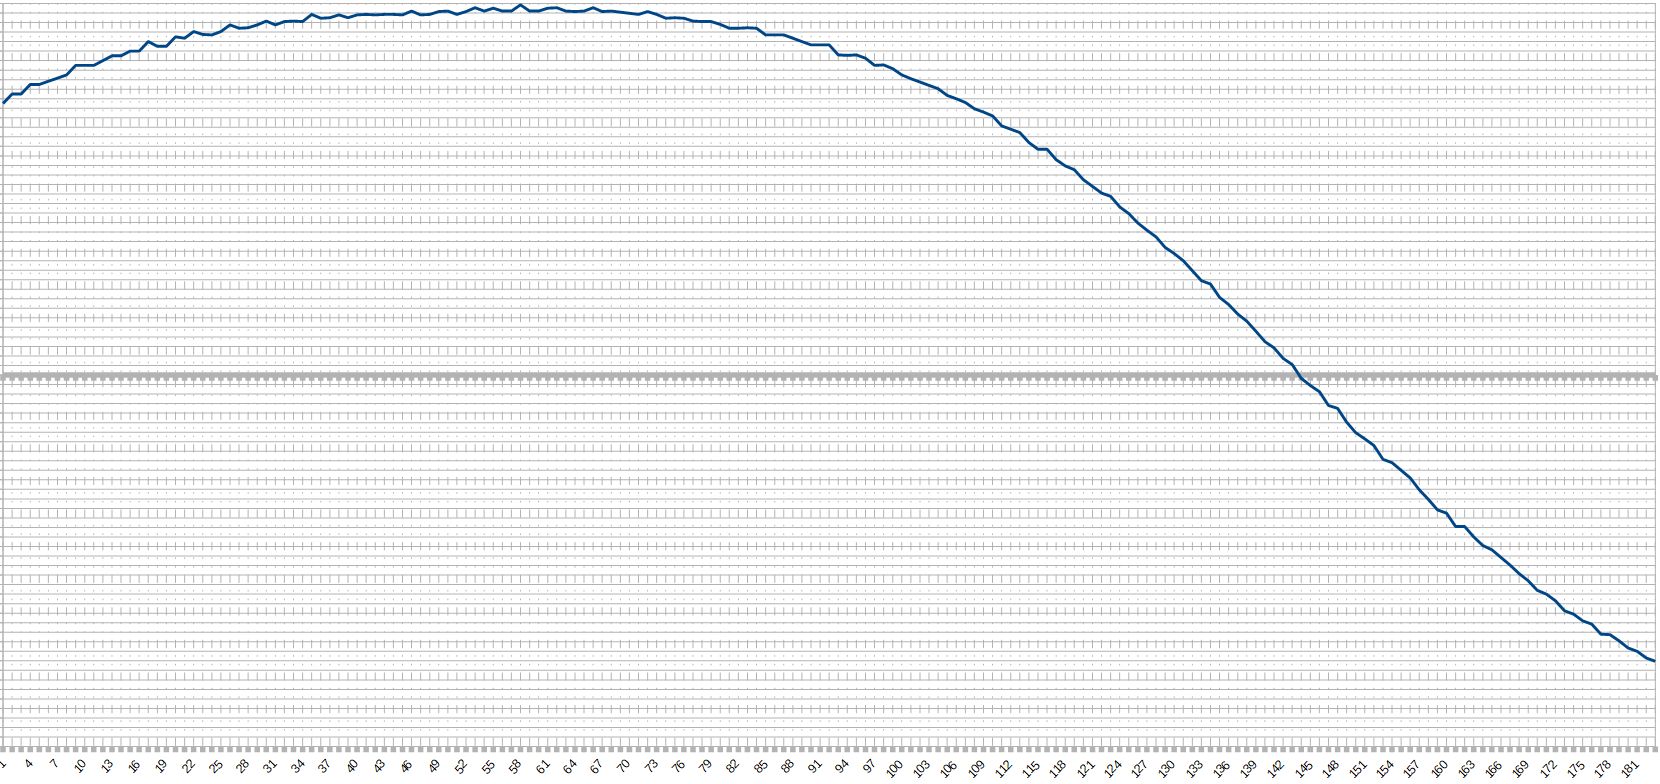
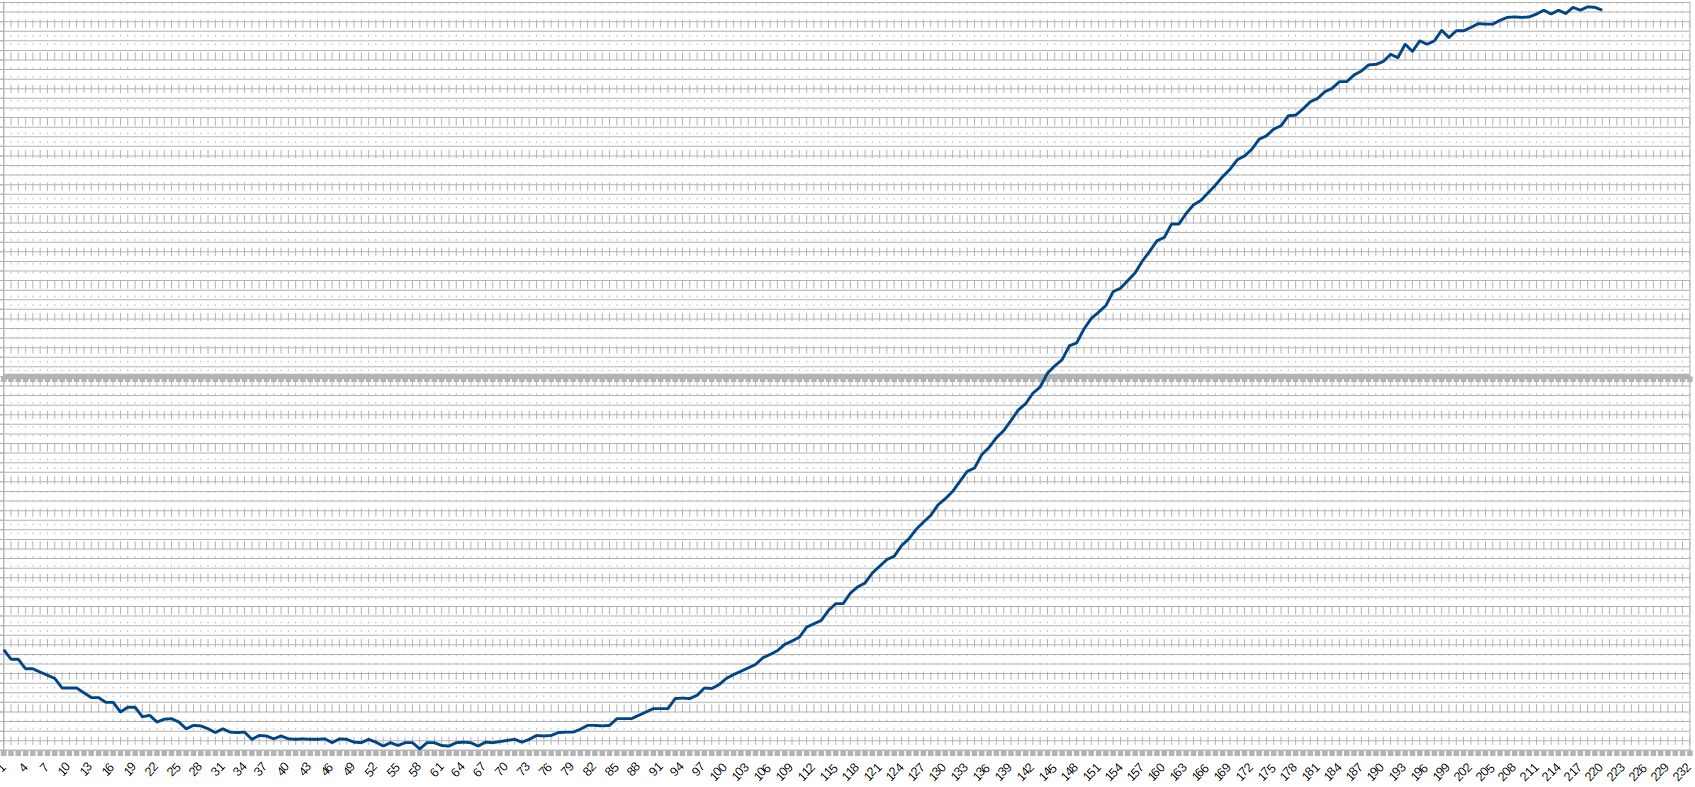
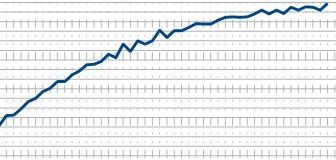
Here is exactly 6 months of data gathering so far…
(Am I the only one that finds this math beautiful?!?)
We are 30 days away from “bottoming out” on the Spring Equinox…
I am curious to see if the negative number will match the positive one precisely…
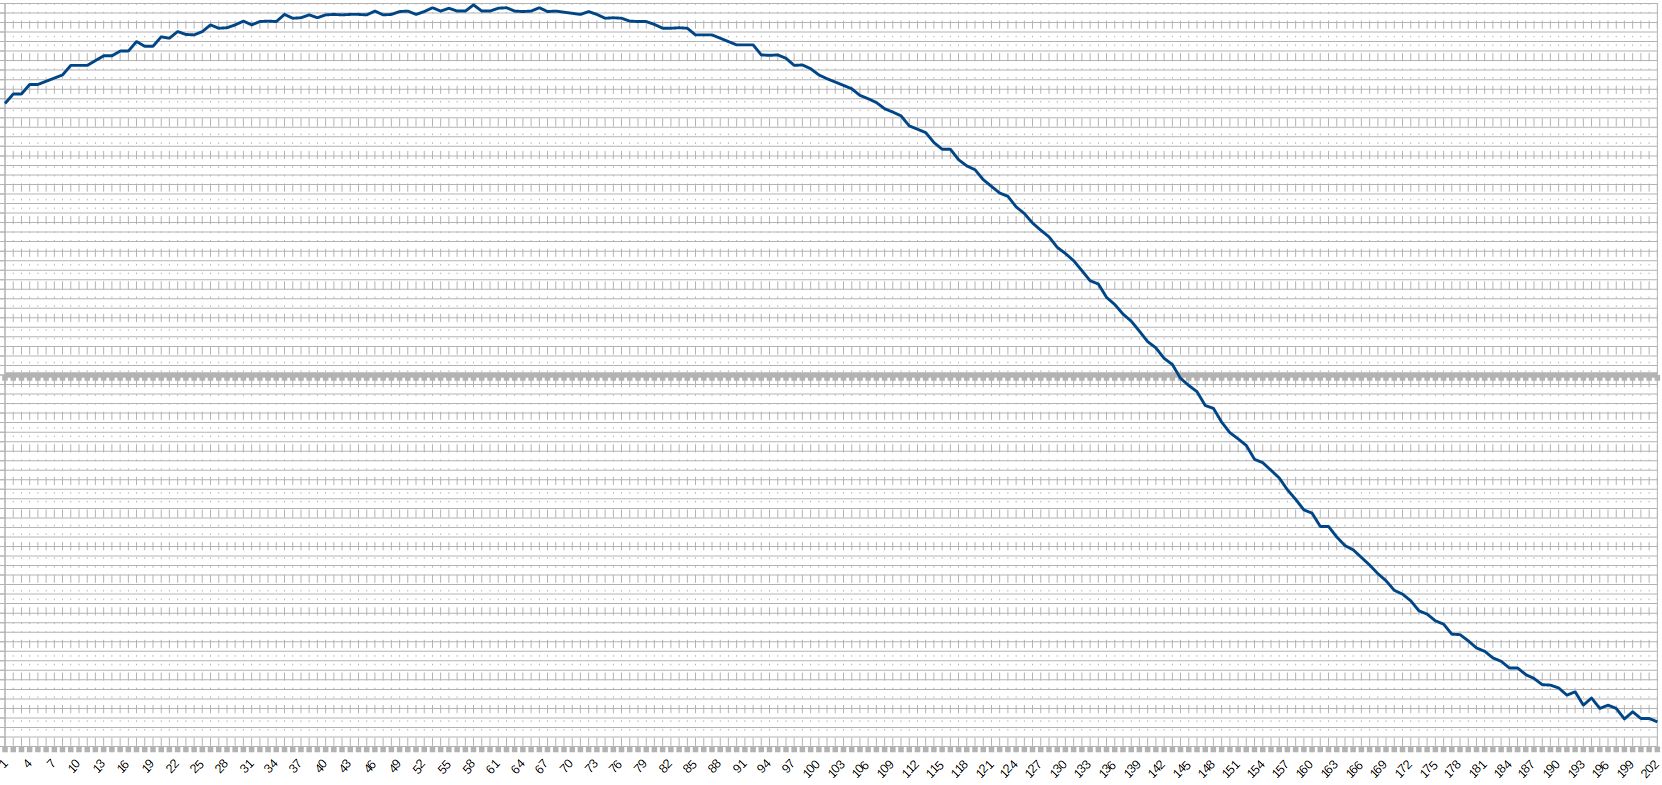
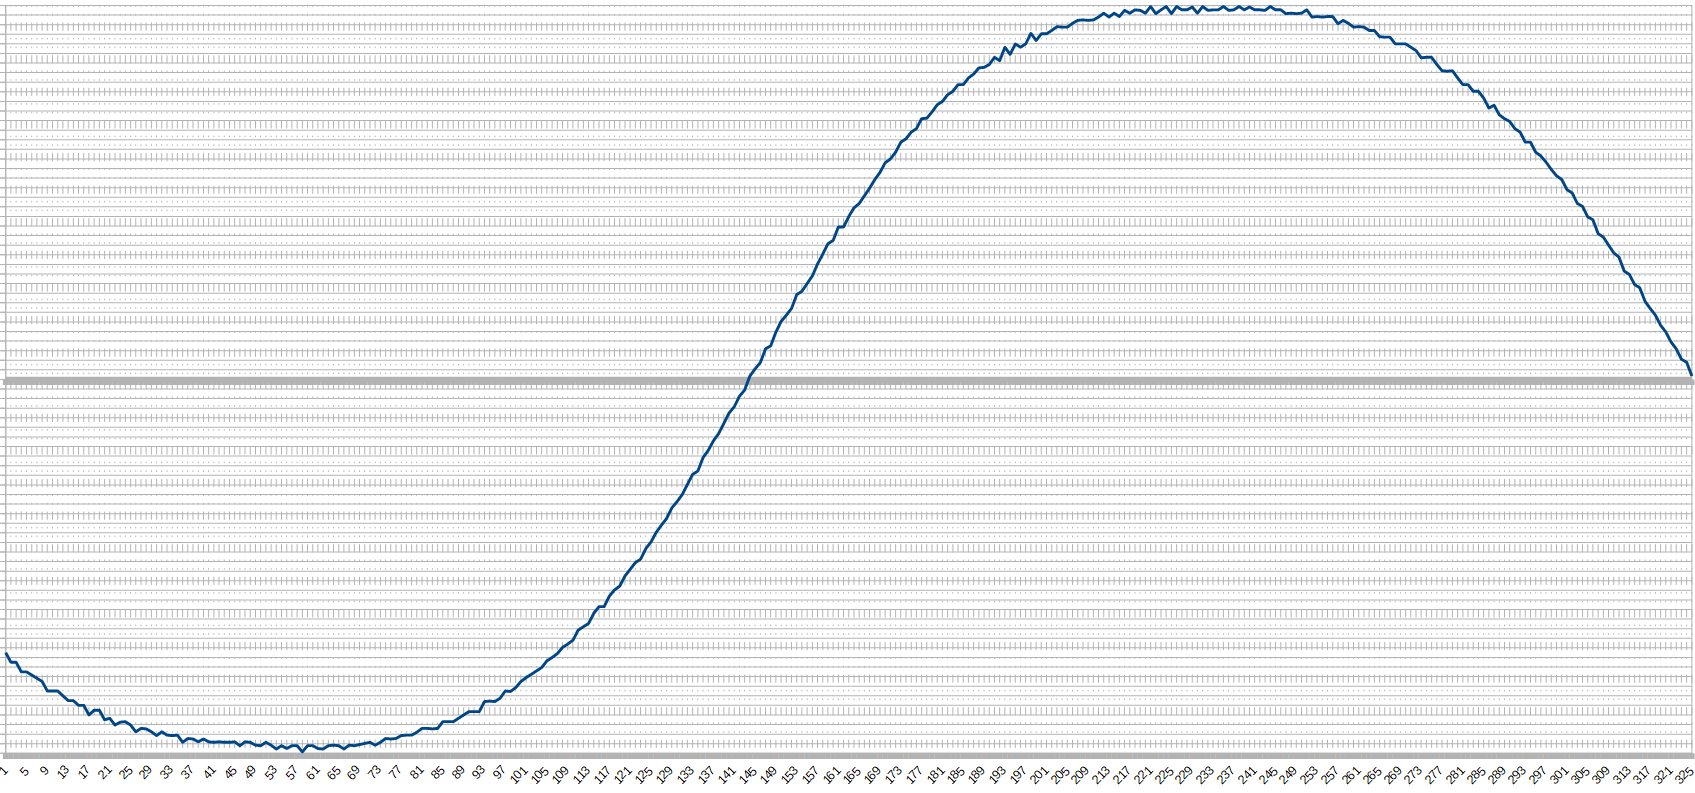
We are three weeks away from the Spring Equinox…
If my math is correct, then it will reach the lowest point in 21 days.
(shown highlighted at the extreme far right)
In other words, over the next 6 weeks, every dayLightLength will increase about the same number of seconds.
Interesting side note:
As observed here, the next six weeks also has the largest increase in dayLength, on a day-by-day basis.
So while my last two statements may sound contradictory, what I really mean is:
The next six weeks will have the “largest consistent increase in daylight” …
(When comparing today’s dayLength to yesterday’s)
In other words, for the next six weeks, the day light length increases at giant steps, (the biggest of the year)… Each day, with the step being almost the same size as the day before.
Well, technically, the largest steps are the week of the Equinox. They slowly start to shrink after that.
… Man, this stuff is hard to talk about sometimes, LOL
Since incorporating astronomy into my SmartHome,
I’m understanding rhythm & cycles on a “whole… 'nother … level…”
I dunno… It is going to be close.
We’re literally one second away from max increase of dayLight, and there’s still 16 days until the Equinox.
(meaning the next 32 days will all have almost identical giant increases in dayLight)
My hunch is the Spring Equinox may surpass the Fall Equinox by a second or two.
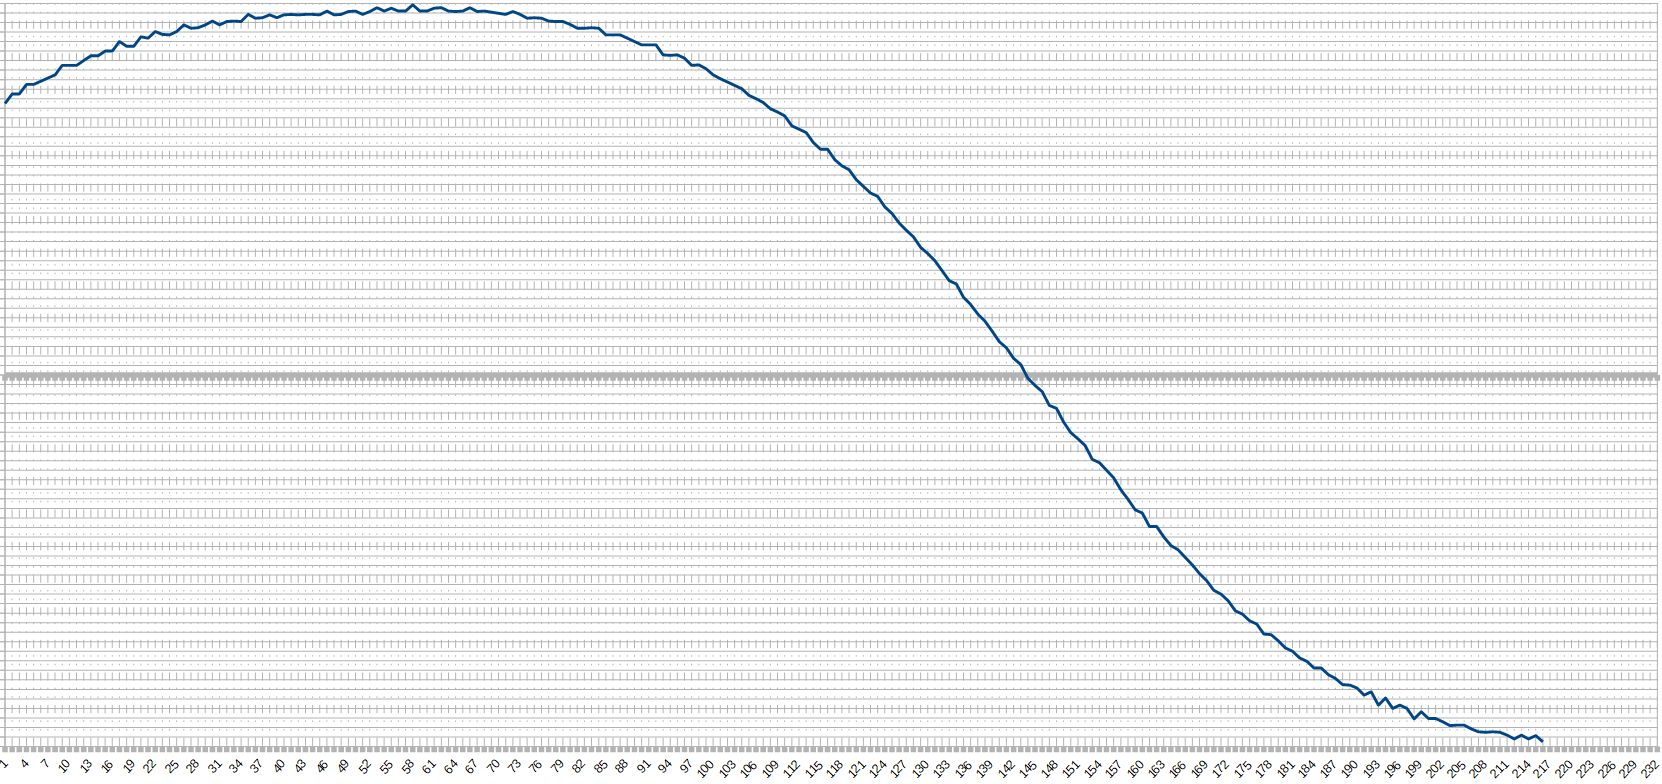
When I started tracking this data, I had no idea what range of data would come in. Looking back on almost 8 months of data, it makes more natural sense to make the “up-stroke” of the graph represent when the dayLight durations are accelerating… and the “down-stroke” of the graph to represent when the dayLight durations are decelerating.
So, here is the exact same data inverted.
(I made all positive numbers negative, and visa versa)
I will be using this from this point forward…
(today’s dayLength) minus (yesterday’s dayLength)
Interesting… We just hit the time change, and the DayLength increase reached the maximum amount on the same day…
Coincidence?
Well, the Spring Equinox has arrived, and my math was spot on… To the exact second!
For the next six months, the dayLength increase will slowly drop each day…
(the dayLength will still increase for 3 months, but less dramatically each day)
Months 4-6 will actually be moving in the other direction (with days getting shorter).
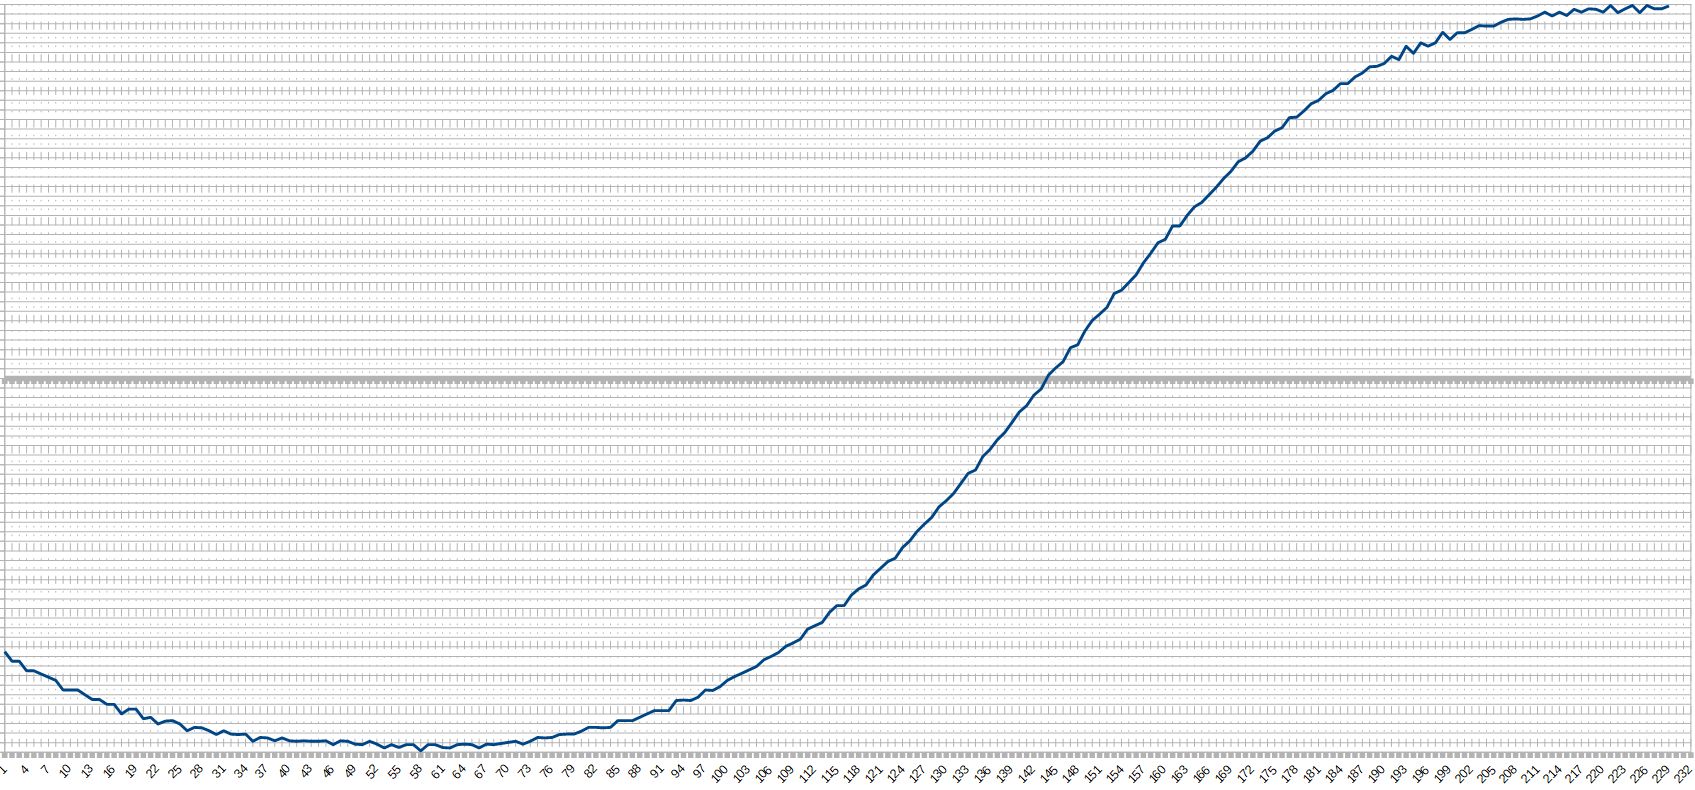
Here is nine months worth of data…
I am really looking forward to seeing this full cycle…
(so I can compare the angles in Summer vs Winter)
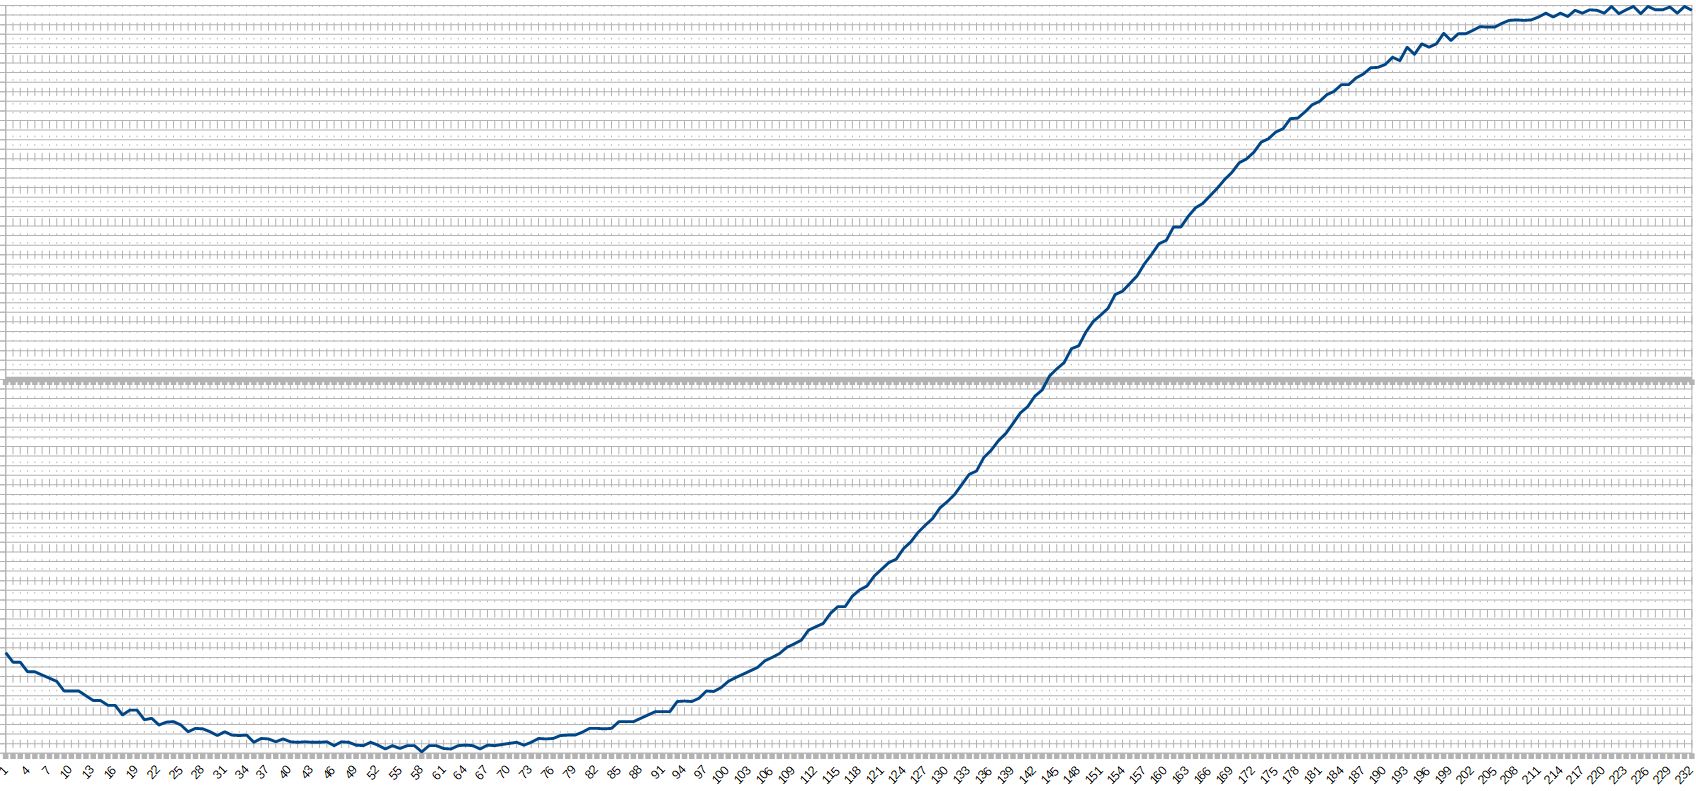
Only two months remaining until I have a full year’s worth of data…
I am going to predict that it will reconnect almost 6 hours later than last year…
(an extra 0.24 days, to account for leap year)
Very curious about what you do for a living.
This is very good and interesting data. Looking forward to seeing the big picture.
I do SmartHome installs locally, and SmartHome programming worldwide…
(although many of my clients are business owners)
Even when I am “off the clock”, most of my hobbies are also science / tech / math related, LOL.
Very nice man. The passion shows. I’m still trying to piece together my smart home. Right now it’s “dumb plus”
Well, you’ve come to the right place…
For what it’s worth, I don’t think I will ever be 100% happy with my SmartHome…
I always have new ideas I want to incorporate. (and I don’t want to ever stop having those!)
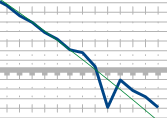
We are a week away from the Summer Solstice… (tomorrow is only 13 sec longer than today)
If the universe behaves, (IE: if my math is good) then the line will intersect at the far right… 
Well, the math checked out nicely…
It crossed over into a negative number on the precise day of the Solstice:
During the Solstice, I calibrated the $twcweather station with a 10 second shift…
So now I have this hiccup in the chart… Notice it now rides a tad higher on the green trend line.
(last picture updated again…)
Edit:
Ths spike is because this chart is based on:
(today’s dayLength) minus (yesterday’s dayLength)
Although, I am tempted to edit that single dataPoint to remove the spike.
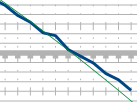
Ahh yes… A much better calibration. 
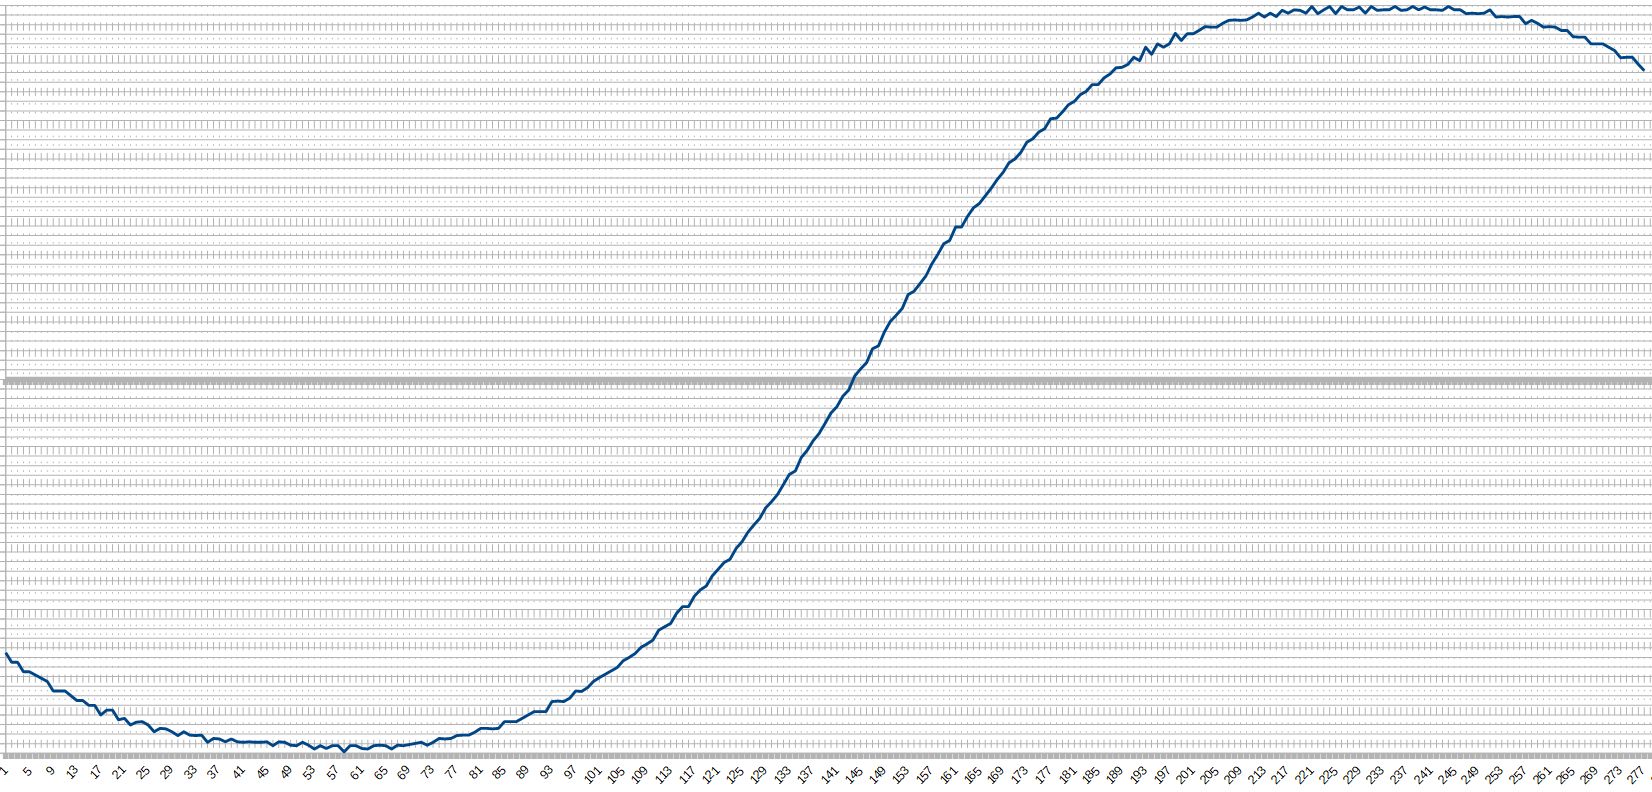
Well, I finally completed 366 days worth of data… Here is the entire year on a 2.4MB loop:
(today is the faint vertical line… Roughly -75%)