
Hi All,
I have piston for sump pumps
when I did I had it set up to email but after 50 emails it stops
I like to be able to track it if I send it to google sheets am I going to have the same problem
Best way to track sump pump and not get throttled?
beau76
#1
WCmore
#2
Only if you use an outgoing Email to send to google sheets…
(there is no daily limit on API or JSON calls)
beau76
#4
@SergL
when it runs and how often it runs and the number of times it run i have two pumps
I have two zooz zen15
SergL
#5
Instead of using WC you could explore options through ST itself. I am graphing a number of data points some of which it seems you might be interested as well. Example below of an AC running but it potentially is applicable in your situation as well. If this is something you might want to try I can help.
WCmore
#6
For long term data storage, @SergL is on a solid path… 
If, on the other hand, you just need quick analysis of the previous 7 days, then using “Fuel Streams” here in webCoRE is super quick and easy. (just be aware that data older than 7 days drops off)
For example, you can add the “Fuel Stream” command to your current triggers…
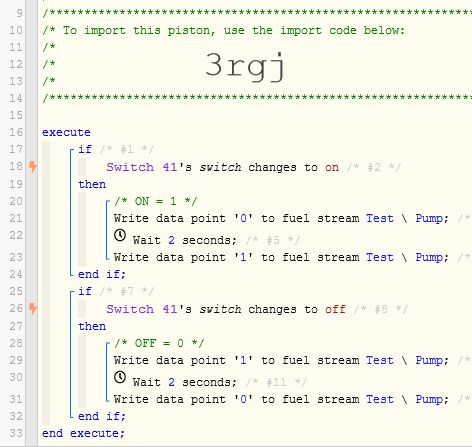
(the extra commands on lines 21 & 29 are just to give you a clean graph, such as my sunrise below)
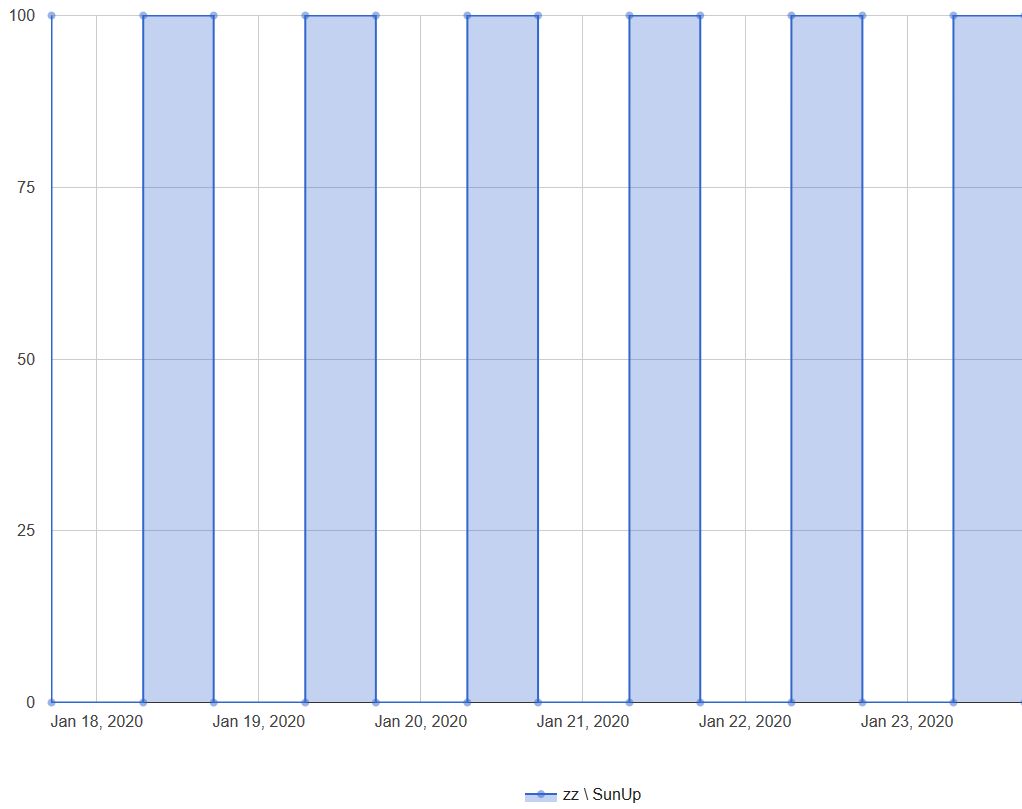
- The grey vertical lines represent midnight
- Hovering your mouse over any point will give you the exact time.
- Solid bars is when the device was On…
- The thicker the colored bar, the longer the device was left On
- The thicker the white space, the longer the device was left Off
This is a great way to get an overview of events that happened in the past week…
beau76
#8
Hi @SergL yes i lke the idea I not sure how it works without webcore
I have one of these for each pump
kevin
#9
You can go from webCoRE directly to google sheets. Use the GoogleSheets logging SmartApp instructions but don’t need the SmartApp. Just use the google sheet template and halfway through the instructions it will tell you to test the URL. That URL is what you use in webCoRE
SergL
#10
The way it works would be to install the logging smartapp in your smartthings system. Assign the devices and parameters you want to log and have it export those to google sheets. From there graph and then use action tiles to display the data. It sounds intricate but once you have set it up once you’ll see its not that hard to do.
Few things this will not do. It will not send you notifications of any means. It will not send any alarms or be able to perform any actions. This would strictly be a viewing option of device activity mostly in historical format.
To get started follow this guide to install the logging smartapp and create a google sheet that gets its data from it. --> https://github.com/krlaframboise/SmartThings/blob/master/smartapps/krlaframboise/simple-event-logger.src/ReadMe.md#simple-event-logger