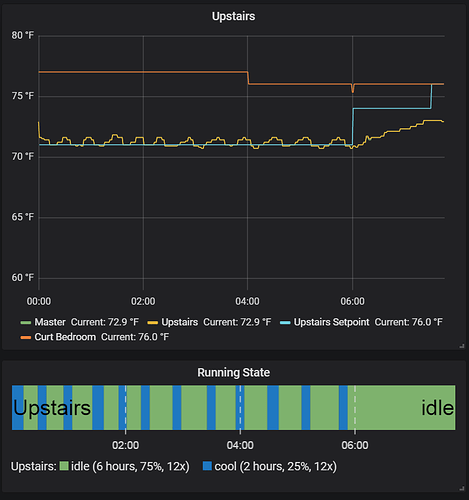
Ecobee monitoring/logging


#1

Ok, I have a bit of a complicated ask for you guys. It involves an ecobee4 thermostat. I’m trying to figure out if my system is short cycling or if it’s a combo of heat and humidifier. What is like to do is either of these 2 things.

  1. Get an alert if the ecobee loses power/reboots.

Or

  1. Write to a log file I can export to csv which puts the time, date, and cycle of the furnace (heat, air, or humidifier).

I looked into ifttt but nothing I can find as a trigger identifies one of the cycles turns on. Was hoping I could tie that to a google doc.

Any suggestions you can offer on other ways to track potential short cycles (either by faulty system or dirty filters) would be greatly appreciated!

Thanks!


#2

Why webCore? Aren’t you better off downloading your system monitor data from Ecobee directly? My Devices->select thermostat->Home IQ->System Monitor->Download data.

It doesn’t show actual trigger times on/off, but tells you how many seconds each thing runs in a given 5 minute increment. That good enough?

Date Time System Setting System Mode Calendar Event Program Mode Cool Set Temp (F) Heat Set Temp (F) Current Temp (F) Current Humidity (%RH) Outdoor Temp (F) Wind Speed (km/h) Cool Stage 1 (sec) Heat Stage 1 (sec) Fan (sec) DM Offset Thermostat Temperature (F) Thermostat Humidity (%RH) Thermostat Motion Living Room (F) Living Room2
1/18/2018 0:00:00 heat heatOff Sleep 77 62 62.2 30 23.2 5 0 0 0 62.4 30 0 62.2 1
1/18/2018 0:05:00 heat heatOff Sleep 77 62 62 29 23.2 5 0 0 0 62.1 29 0 62 1
1/18/2018 0:10:00 heat heatOff Sleep 77 62 61.7 29 23.2 5 0 0 0 61.6 29 0 61.8 1
1/18/2018 0:15:00 heat heatOff Sleep 77 62 61.6 29 23.2 5 0 15 15 61.3 29 0 61.6 0
1/18/2018 0:20:00 heat heatStage1On Sleep 77 62 61.4 30 23.2 5 0 300 300 61.3 30 0 61.4 0
1/18/2018 0:25:00 heat heatStage1On Sleep 77 62 61.4 30 23.2 5 0 225 270 62.1 30 0 61.4 0
1/18/2018 0:30:00 heat heatOff Sleep 77 62 62.1 30 20.5 6 0 0 0 62.6 30 0 62.1 0

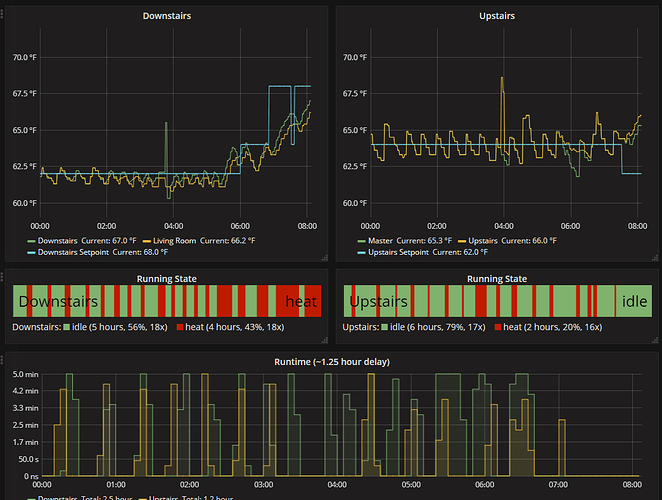
Personally, I have a python script that grabs the data automatically (through ecobee API, not their data file), and logs into influxdb which I then view with Grafana.


#3

Well well we’ll… apparently I have overthought this… I am so caught up in HA I forget these devices often have a native app that can be useful. I’ll log on to the site and check it out. I am not a coder, so I may reach out to you about what you did to get your data for some help if you don’t mind.


#4

@milhouse, I’m interested in doing exactly what you are with the Ecobee API to Influxdb. I’m using curl to grab the data on linux using influxdb in docker container. Can you share with me your code you are using to insert the data into the db? The data I’m getting is in the following format FYI:

{
“columns”: “auxHeat1,compCool1,fan,outdoorTemp,zoneAveTemp”,
“reportList”: [
{
“thermostatIdentifier”: “318324702718”,
“rowCount”: 863,
“rowList”: [
“2014-12-31,19:00:00,0,0,0,17.6,71.6,”,
“2014-12-31,19:05:00,0,0,0,17.6,71.7,”,
“2014-12-31,19:10:00,0,0,0,17.6,71.6,”,
“2014-12-31,19:15:00,0,0,0,17.6,71.5,”,
“2014-12-31,19:20:00,0,0,0,17.6,71.5,”,
“2014-12-31,19:25:00,0,0,0,17.6,71.5,”,
“2014-12-31,19:30:00,0,0,0,17.6,71.4,”,
“2014-12-31,19:35:00,0,0,0,17.6,71.1,”,
“2014-12-31,19:40:00,0,0,0,17.6,69.6,”,
“2014-12-31,19:45:00,0,0,0,17.6,69.5,”,
“2014-12-31,19:50:00,0,0,0,17.6,69.5,”,
“2014-12-31,19:55:00,30,0,30,17.6,69.4,”,
“2014-12-31,20:00:00,300,0,300,17.6,68.9,”,
“2014-12-31,20:05:00,300,0,300,17.6,68.3,”,
“2014-12-31,20:10:00,300,0,300,17.6,68.4,”,
…snipped…
“2015-01-03,17:50:00,300,0,300,32,69.4,”,
“2015-01-03,17:55:00,165,0,210,32,69.7,”,
“2015-01-03,18:00:00,0,0,0,32,70.3,”,
“2015-01-03,18:05:00,0,0,0,32,70.9,”,
“2015-01-03,18:10:00,0,0,0,32,70.9,”,
“2015-01-03,18:15:00,0,0,0,32,70.9,”,
“2015-01-03,18:20:00,0,0,0,32,71.1,”,
“2015-01-03,18:25:00,0,0,0,32,71.3,”,
“2015-01-03,18:30:00,0,0,0,32,71.6,”,
“2015-01-03,18:35:00,0,0,0,32,70.6,”,
“2015-01-03,18:40:00,0,0,0,32,70.3,”,
“2015-01-03,18:45:00,0,0,0,32,70.2,”,
“2015-01-03,18:50:00,0,0,0,32,70.1,”
]
}
],
“sensorList”: [],
“startDate”: “2015-01-01”,
“endDate”: “2015-01-03”,
“status”: {
“code”: 0,
“message”: “”
}
}

#5

I have it wrapped into a python script.

import ecobee
from influxdb import InfluxDBClient
from datetime import datetime
import pytz

def logPoint(sensorName=None, sensorValue=None, sensorType=None,recordedTime=None):
    return {
        "measurement": sensorType,
        "time": recordedTime,
        "tags": {
            "sensor": sensorName
        },
        "fields": {
            "value": sensorValue
        }
    }

client = InfluxDBClient(host='192.168.2.52',
                        port=8096,
                        database='ecobee',
                        username='grafana',
                        password='yourgrafanapassword',
                        verify_ssl=False)


APIKEY = "yourEcobeeAPIKey"

points = []
eapi = ecobee.Client(APIKEY,scope='smartRead')

thermostats = eapi.list_thermostats()

local = pytz.timezone ("US/Eastern")

for thermostat in thermostats:
    tid = str(thermostat.id)
    name = str(thermostat.name)
    temp = str(thermostat.current_temperature)
    humidity = str(thermostat.current_humidity)
    state = str(thermostat.state)
    setpoint = str(thermostat.target_temperature)
    is_heating = int(thermostat.is_heating)
    is_cooling = int(thermostat.is_cooling)

    report = eapi.runtimeReport(tid)
    for reportlists in report['reportList']:
        for row in reportlists['rowList']:
            myday,mytime,auxHeat1,compCool1,fan,eol = row.split(",")
            date_str = str(myday) + " " + str(mytime)
            datetime_obj = datetime.strptime(date_str, "%Y-%m-%d %H:%M:%S")
            local_dt = local.localize(datetime_obj, is_dst=None)
            utc_dt = local_dt.astimezone (pytz.utc)
            builttime = utc_dt.strftime ("%Y-%m-%dT%H:%M:%SZ")

            if auxHeat1 is not '':
                points.append(logPoint(sensorName=name, sensorValue=float(auxHeat1), sensorType="heattime", recordedTime=builttime))
            if compCool1 is not '':
                points.append(logPoint(sensorName=name, sensorValue=float(compCool1), sensorType="cooltime", recordedTime=builttime))
            if fan is not '':
                points.append(logPoint(sensorName=name, sensorValue=float(fan), sensorType="fantime", recordedTime=builttime))


client.write_points(points)

It looks like your report is close to the same format as mine, except you’ve got a few extra columns on the end for outdoor and average temp.

The nesting of the report data is
thermostats
reportlist
row
I am guessing you have just one thermostat, so you can set name directly without having to get the thermostat list from the API.

So I think that you can concentrate on the bit of my code starting with report = eapi.runtimeReport(tid). You can use report = (your report above). The parse the records (for reportslists… and for row…). Fix your row parsing to include the extra columns you’ve got.

The lines of code dealing with date_str are about combining the date + time, connverting to a datetime object, then converting to UTC to store in InfluxDB.

Then I build the actual points to append. Occassionally the Ecobee data has some blank values instead of 0, so I filter those out, then append the next point for the record. Then actually writing the data to InlfuxDB is client.write_points(points).

Hopefully this will get you started!

milhouse


#6

I should note: The runtime report you are using seems to be at ~ 1.25 hour delay. I use it for these charts here:

The script above runs, I think, every 30 minutes.

For more up-to-date information I have a different script that runs every 3 minutes. This one just gets the thermstat and sensor information, not the actual runtime report.
import ecobee
from influxdb import InfluxDBClient

def logPoint(sensorName=None, sensorValue=None, sensorType=None):
    return {
        "measurement": sensorType,
        "tags": {
            "sensor": sensorName
        },
        "fields": {
            "value": sensorValue
        }
    }

client = InfluxDBClient(host='192.168.2.52',
                        port=8096,
                        database='ecobee',
                        username='grafana',
                        password='yourgrafanapassword',
                        verify_ssl=False)

APIKEY = "yourecobeeapi"
points = []
eapi = ecobee.Client(APIKEY,scope='smartRead')

thermostats = eapi.list_thermostats()

for thermostat in thermostats:
    tid = str(thermostat.id)
    name = str(thermostat.name)
    temp = str(thermostat.current_temperature)
    humidity = str(thermostat.current_humidity)
    state = str(thermostat.state)
    setpoint = str(thermostat.target_temperature)
    is_heating = int(thermostat.is_heating)
    is_cooling = int(thermostat.is_cooling)

    print("thermostat_name = " + name + ", temp = " + temp + ", humidity = " + humidity + ", state = " + state + ", setpoint = " + setpoint)
    points.append(logPoint(sensorName=name, sensorValue=float(temp), sensorType="temp"))
    points.append(logPoint(sensorName=name, sensorValue=float(humidity), sensorType="humidity"))
    points.append(logPoint(sensorName=name, sensorValue=str(state), sensorType="state"))
    points.append(logPoint(sensorName=name, sensorValue=float(setpoint), sensorType="setpoint"))
    points.append(logPoint(sensorName=name, sensorValue=float(is_heating), sensorType="heating"))
    points.append(logPoint(sensorName=name, sensorValue=float(is_cooling), sensorType="cooling"))
    
    # there is only one remote sensor per thermostat. Otherwise loop over thermostat.list_sensors()
    sensor = thermostat.get_sensor("rs:100")
    name = str(sensor.name)
    temp = str(sensor.temperature)
    occupancy = bool(sensor.occupancy)
    print("sensor_name = " + name + ", temp = " + temp + ", occupied = " + str(occupancy))
    points.append(logPoint(sensorName=sensor.name, sensorValue=float(temp), sensorType="temp"))
    points.append(logPoint(sensorName=sensor.name, sensorValue=bool(occupancy), sensorType="occupancy"))


client.write_points(points)

This almost-live information is used for these Grafana charts:

And my favorite graph, daily runtime against average daily high temp:


#7

This is really great! Thanks so much. I actually have 3 thermostats, but only gave you an example of the data from the website api page, but I was pulling that data via the curl statement. I’m fairly new to Influxdb and am still trying to wrap my head around putting data in there and what is considered a tag, vs fields etc an how the data is best inserted in there. I’m thinking your example will be perfect as I’m actually just wanting the same information you are looking at.

I’m using Hassio running on Docker on linux ubuntu 18.04. I was thinking I’d run this python in a docker and insert from there. I have my fan running at least 10 min each hour to circulate around the house, so I wanted to capture the runtimes of the fan, vs when it’s actually cooling/heating like you’ve done.

I have enabled influxdb in Hass but it doesn’t grab the details of when the heat runs vs cool etc., at least not that is readily understandable in influxdb, so trying to get this detailed info from a different source.

I’m going to work with this great example and hope you don’t mind if I ping you with question:) Thanks!