Yes because I agree, our %ages should be the same.
It’s quite possible that the source data we are using is off slightly too.

Yes because I agree, our %ages should be the same.
It’s quite possible that the source data we are using is off slightly too.
I think sunset will differ from location to location because of tilt of the earth. And where you are on the latitude scale. Have a cabin 300 miles to the north of me and sunset is approximately minutes difference. And sunrise is off by 15 minutes.
You are definitely correct, @Gopack2, but the number we were comparing is not comparing sunset or sunrise times. It is (basically) a number from 0-100 where 0 is the shortest day of the year, and 100 is the longest day of the year. So even though the sunrise/sunset happens at different times for all of us, we all hit 0, 50 and 100 on the same day. (winter solstice, equinoxes and summer solstice respectively)
Mine shows 14.9% now too. 
@Alwas, how many decimals are you using in your multiplier?
(I have 17, but I think webCoRE defaults to 6)
If you use too few decimal places, I would expect the percentage would be slightly off…
I guess one other possibility for the slight variation is I scanned thru the next ten years and found the absolute shortest day in December and absolute longest day in June. There wasn’t much difference, but I based my math on the very extreme data points.
On an unrelated note:
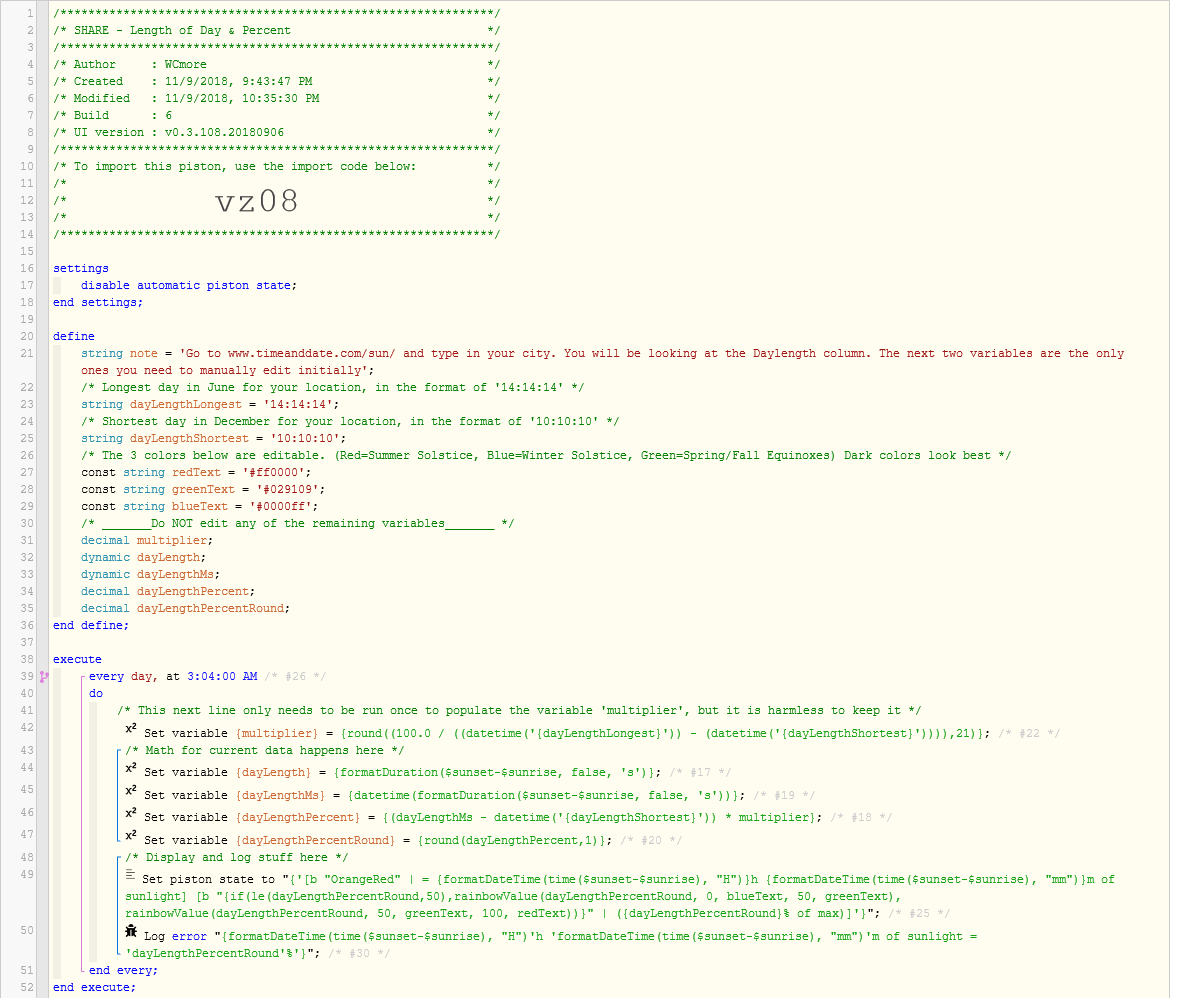
For those mathematically challenged, or who may have resisted this piston because of it’s complexity, I have good news… I somehow got all that ‘mumbo-jumbo’ into a piston that I can finally share with the public!
For this piston to work for your location, you must change the variables on line 23 & 25.
(instructions are at the very top of the piston)
It runs once a day, and updates the piston state as well as leaves a nice data trail in the logs.
(Also, this piston uses webCoRE’s maximum of 21 decimals for accuracy)
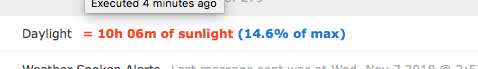
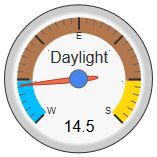
Example output:
![]()
(The percentage changes color throughout the year to reflect the amount of sunlight)
If you want one of the gauges as seen above, it should be easy to add the code from one of my earlier posts to the bottom of this piston.
I actually use a different piston to draw my gauges, and simply refer to the percentage created by this piston. If you go this route, you will want to enable the global variable currently disabled & hidden in this picture.
(you will see it if you import vz08)
For those curious, I chose 3:04 am because:
Decimal. It is currently set at one decimal in the code
Also, you can reduce to a single @ if you want. I use double because I am spanning across instances
Ok i got the piston working, I just can’t get the tile to display…
AM i missing sometinhg>?
I have the category set to this:
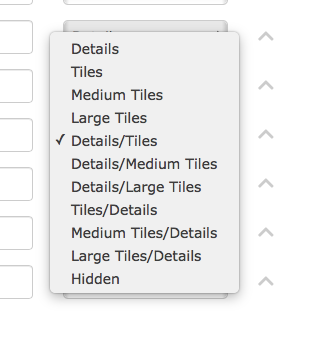
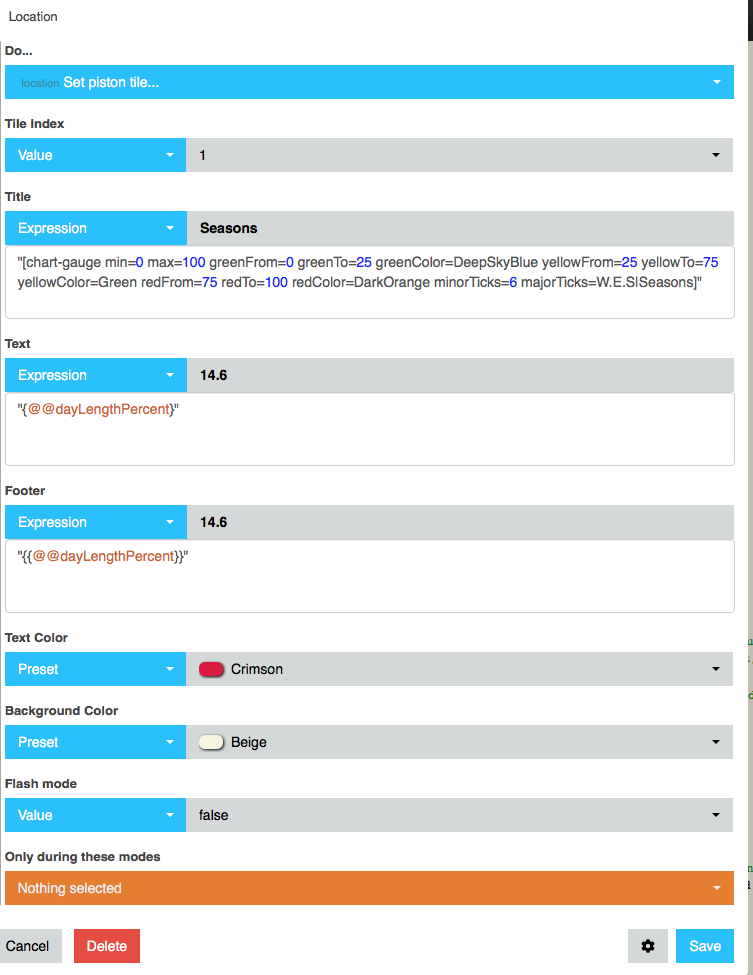
The Title is written a bit differently if you use an expression…
I use Value for Title:
[chart-gauge min=0 max=100 greenFrom=0 greenTo=16 greenColor={colorWinterBegin} yellowFrom=16 yellowTo=84 yellowColor={colorFall} redFrom=84 redTo=100 redColor={colorSummerEnd} minorTicks=6 majorTicks=W..E..S|Daylight]
Everything in curly brackets are variables that I set at the top of the piston, like this:
![]()
Part of the Value is cut off in this screenshot:
Also note there is no brackets or quotes in the Text or Footer expression
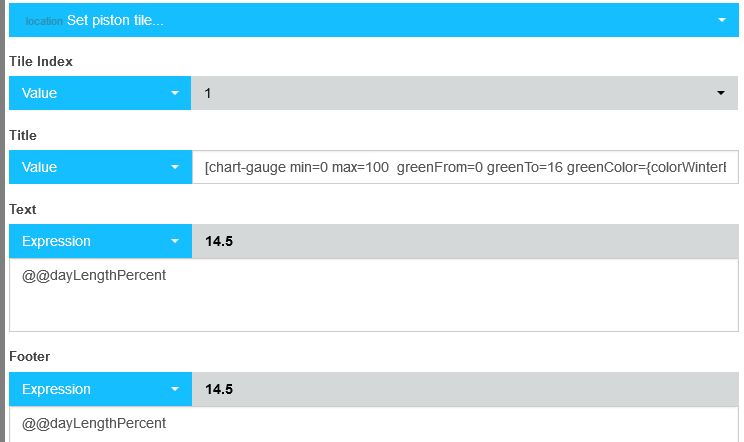
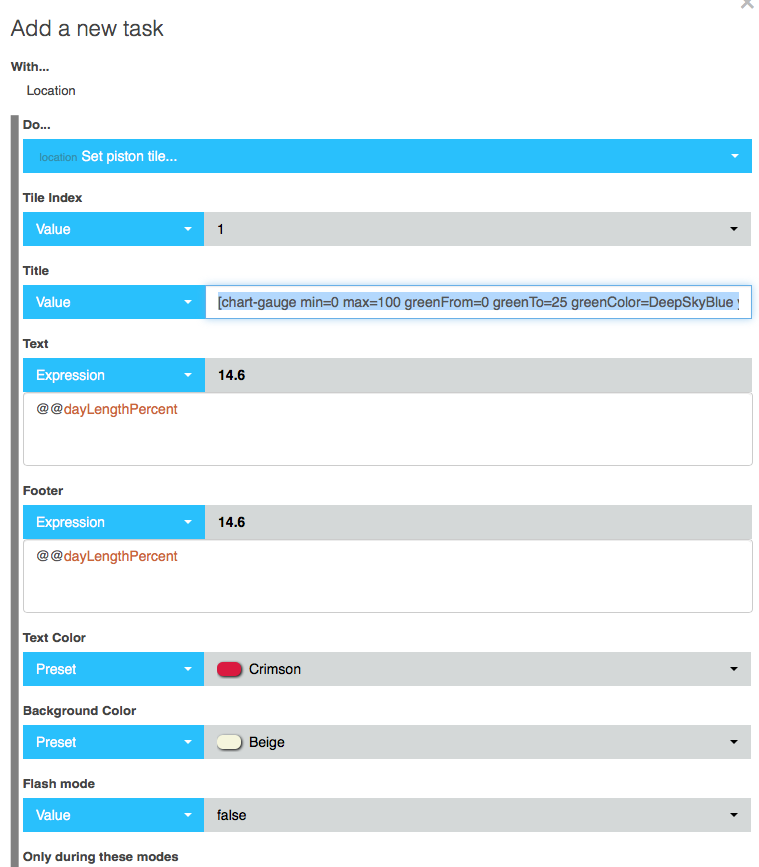
Alright, I changed the “title” field to “value”…and entered this into that field.
[chart-gauge min=0 max=100 greenFrom=0 greenTo=25 greenColor=DeepSkyBlue yellowFrom=25 yellowTo=75 yellowColor=Green redFrom=75 redTo=100 redColor=DarkOrange minorTicks=6 majorTicks=W.E.S|Seasons]
I still can’t get the tile to display…any suggestions?
Well, is the piston set to only run once a day?
You could temporarily change the time during testing.
Also, I added a bunch of info to my last post might be worth re-reading
Yes, I have been changing the time to run in a minute after I edit it to see if it’s working. I’ll read what you posted.
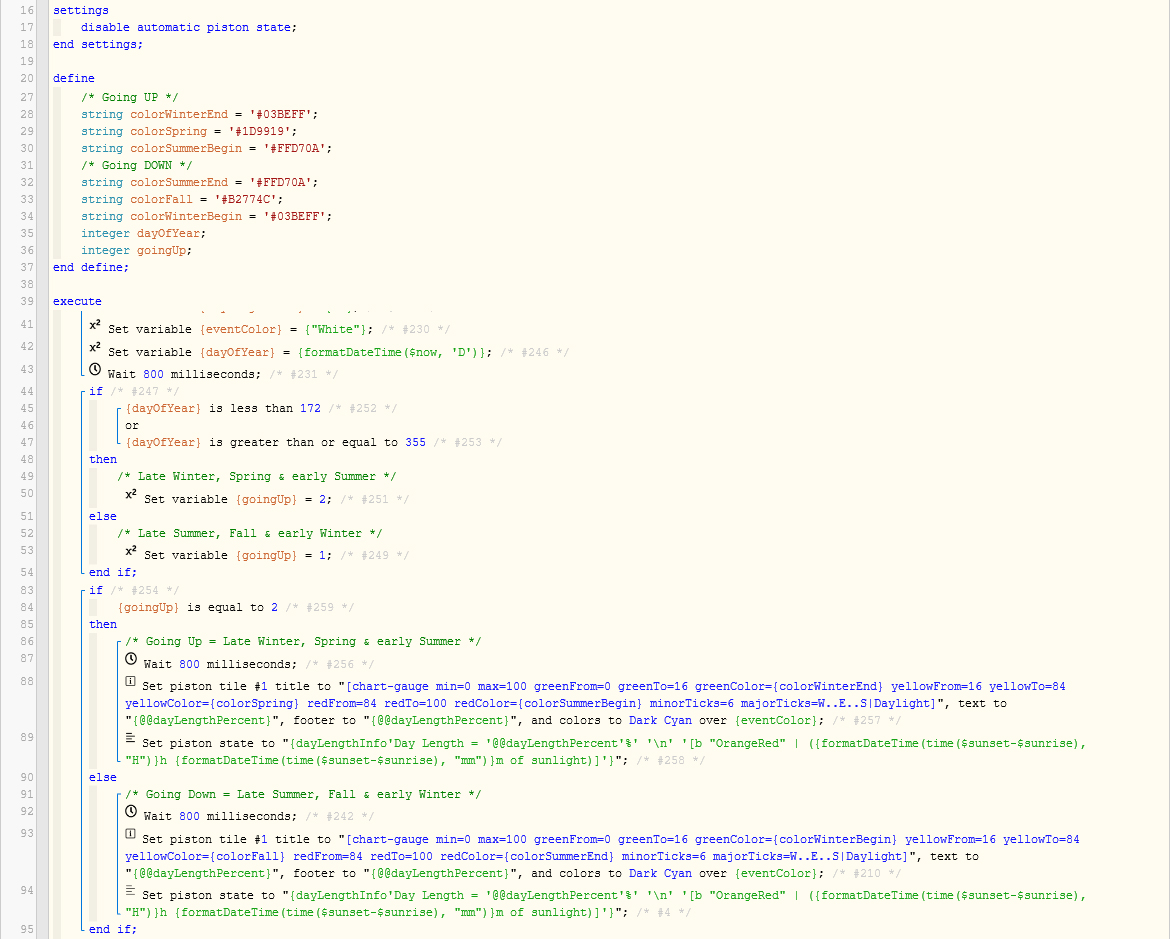
My piston that draws my gauge has a bunch of code in there that is not ready for the public, so I cannot share the import code, but here is the important code that draws my gauge.
Which returns this tile:
The extra code is there because I wanted brown to be shown in the fall, and green in the spring.
(since half the year the dial moves to the right, and half the year it moves towards the left)
Also, the reason I chose 16 & 84 (instead of 25 and 75 like you did) is because the year is split up perfectly if you use 16 & 84. (the dial spends exactly 3 months in each color)
I got this working now…This is neat!!!
I had my “set piston tile” info in the wrong area before…but it’s working now…I like your last post (piston screenshot without the import code…) I’ll fool with that at a later time…
Nice Work!
one question, I know i can go into settings in webcore and make the tile size larger, but the gauge still stays the same size…I how do i resize the gauge to compensate for the larger tile size?
Ctrl-F5 from your dashboard will redraw the tiles.
(it will NOT pull new data, but it redraws it based on the html)
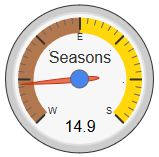
With only a few days of Fall remaining, and the Winter Solstice nearly upon us, I figure some of you may appreciate a recent screenshot.
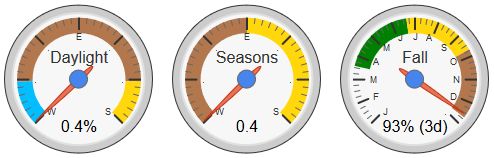
Everything is tracking along beautifully!