How do I Read the Piston Statistics


#1

So this isn’t necessarily piston design help, more IDE help.

At the very bottom of my piston screen, there’s this statistics graph:

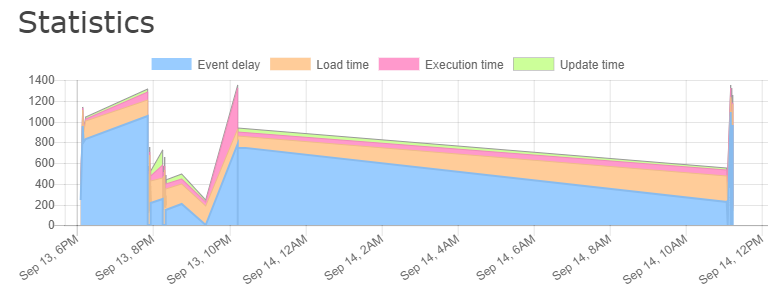
I’m assuming that this shows me the runtime statistics and through this I’ll be able to make my pistons more efficient, but how do I know what’s good and what’s bad? What baselines should I look for?


#2

bump


#3

here i will take a crack at it … @ady624 can correct if needed:

event delay:    delay between event being generated to webcore receiving the event from ST
load time:      time it takes to load the piston code
execution time: time it takes for piston code to execute
update time:    updating piston state to store before processing next event for same or different piston

users have no direct control over blue and green colored stats in the chart. indirect control over stats in orange and pink.


#4

so the numbers on the left are in milliseconds?


#5

yes.