Looking for Explanation of Fuel Streams


#1

Since I don’t see it posted anywhere in the community I thought I would ask it here.

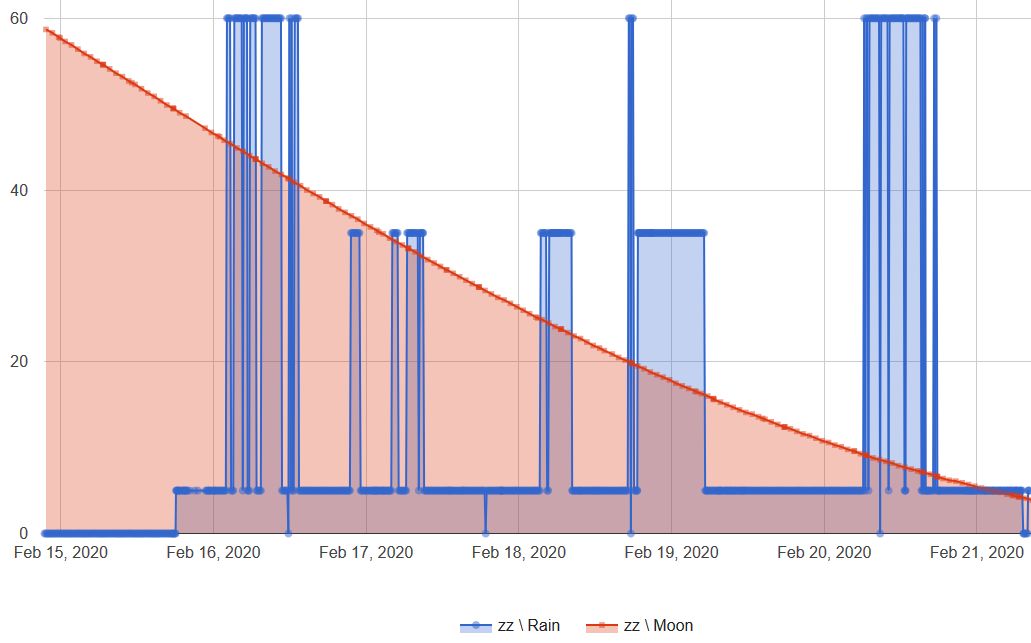
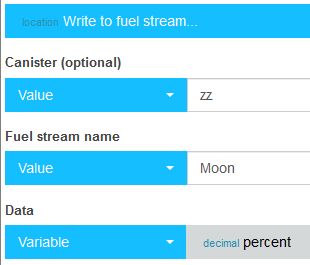
The Wiki says that a fuel stream is a way to look at pretty graphs, but that’s it. Can anyone give a better explanation of what they are, how they work, why someone would use one, and even better yet, how to actually get a pretty graph from one of these fuel streams?

I’m pretty savvy technically speaking, but I just started diving into Webcore after I realized just how limited ST is, so feel free to give me all the nitty gritty details.


#2

Here are a few notes that may be helpful:

Fuel streams can add numbers to a graph whenever a piston sends the appropriate command.

After 7 days (or 1000 dataPoints), the old data drops off forever.

Multiple pistons can write to the same Fuel Stream…
or…
A single piston can write to multiple Fuel Streams…

Multiple Fuel Stream graphs can be shown simultaneously.

Here is a sample showing the amount of luminosity in the moon (currently at 4%), and the probability of rain over the past 7 days:


Note:

During testing, if you add a single bad dataPoint (something that is not a valid number), then that entire Fuel Stream will be corrupted, and not display anything for the next 7 days. Once the bad data drops off, then the fuel stream will go back to working once again.

Also, choose your names (and containers) very carefully, since there is no way to edit them once created.


#3

And here is the actual code that writes the moon data to my Fuel Stream:

pic

Not shown here, but in a previous step, I stored the moon’s illumination into the variable called {percent}.
This Fuel Stream code simply writes that number to the stream.


#4

Thanks for pointing me in the right direction and for the setup details! I’ll go check it out.