Tracking switch on totals


#1

1) Give a description of the problem
I’m attempting to display total time on for a virtual switch in a variety of ways.
For example. I’d like to see

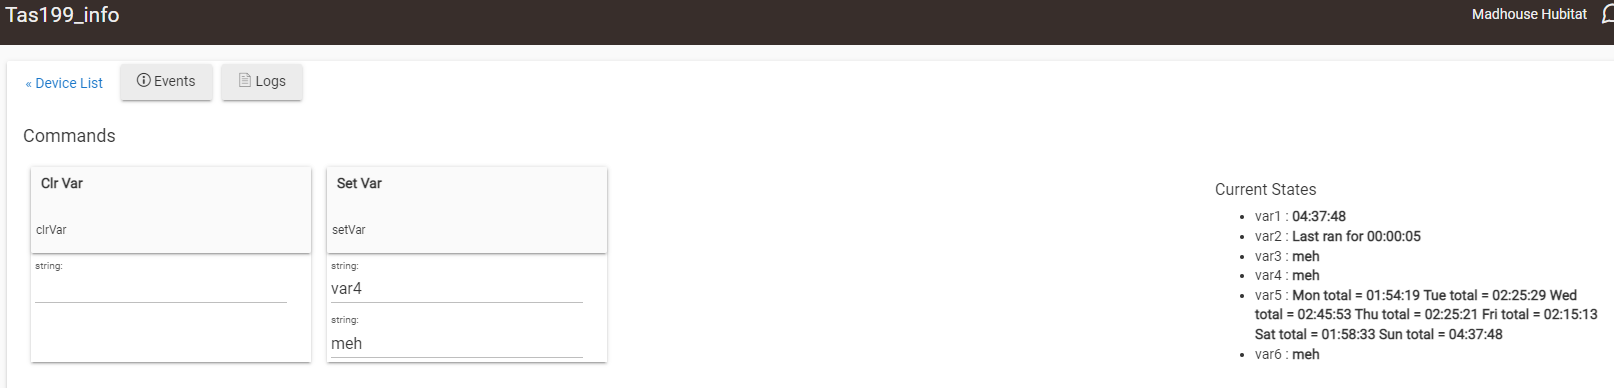
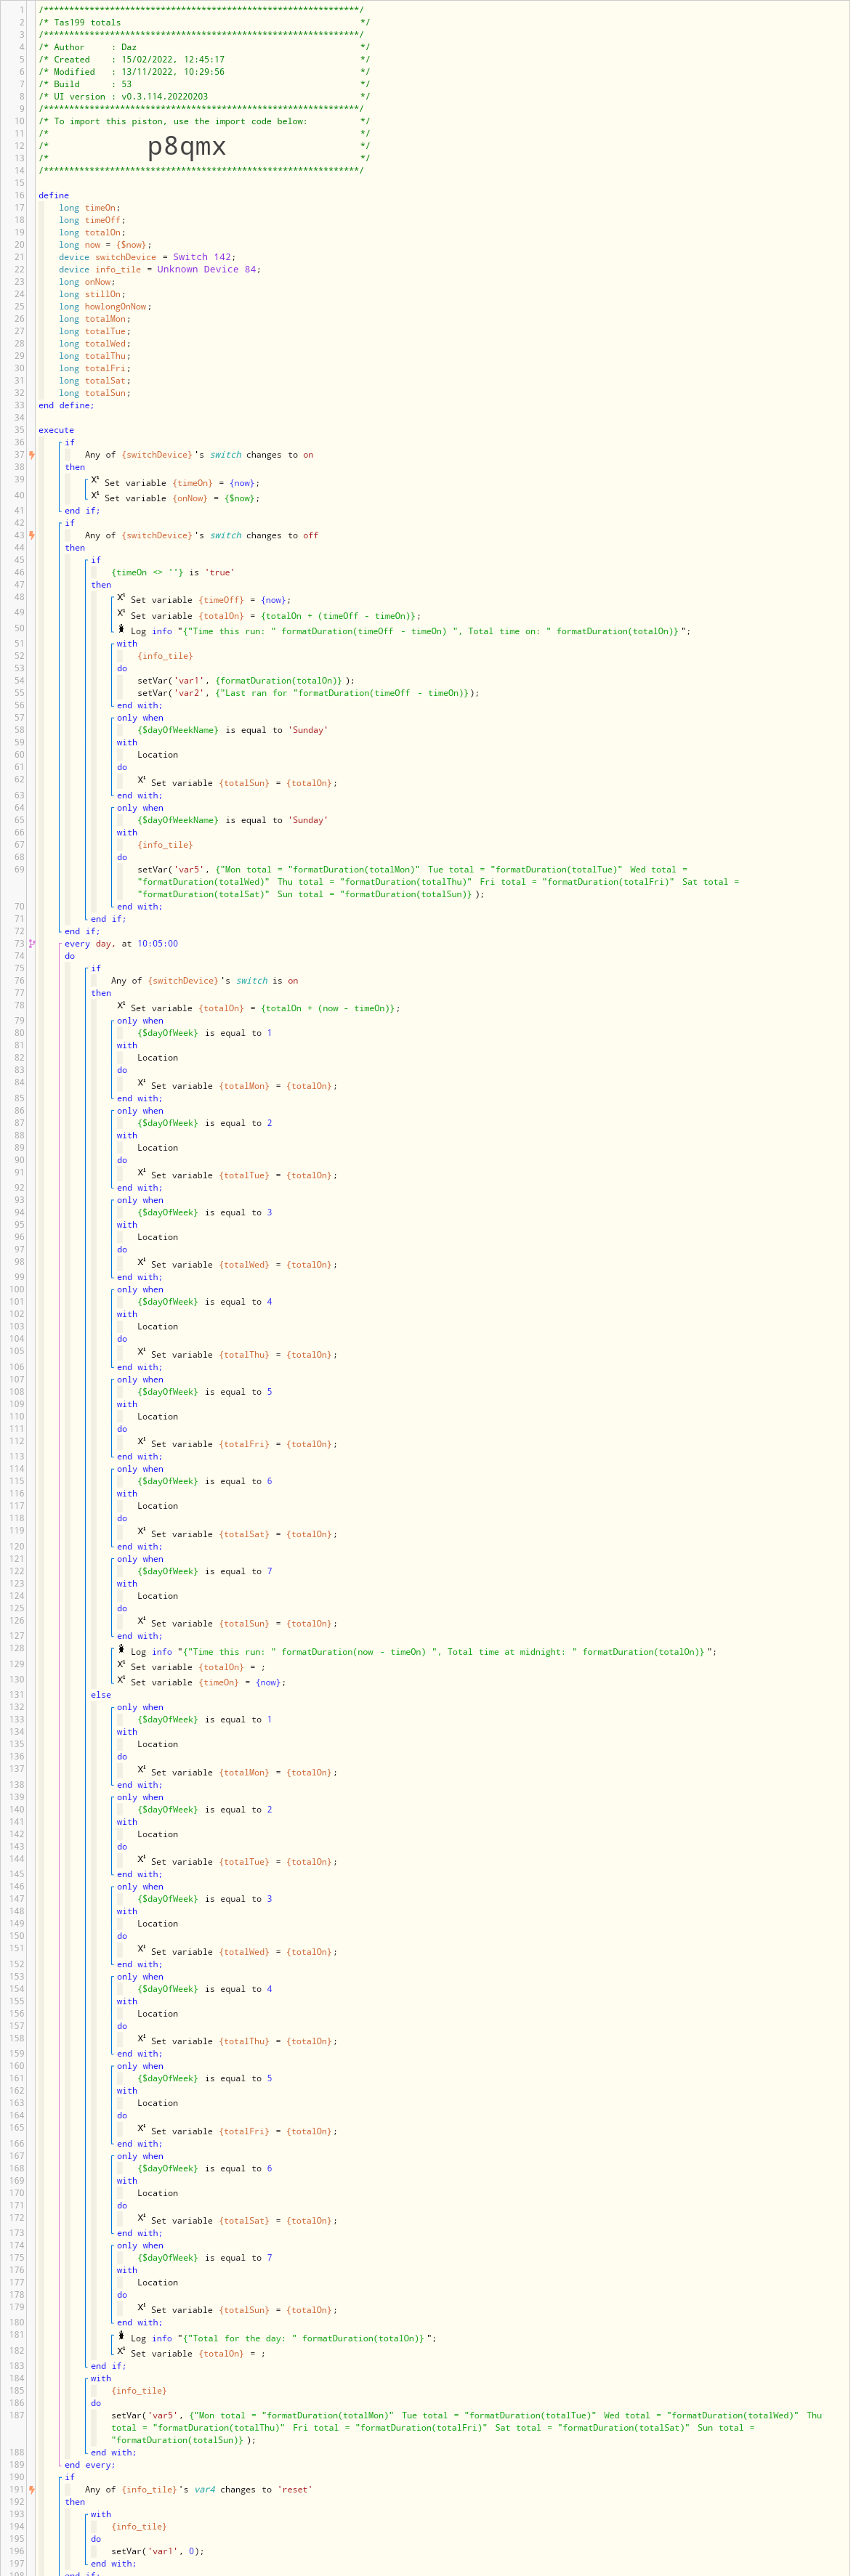
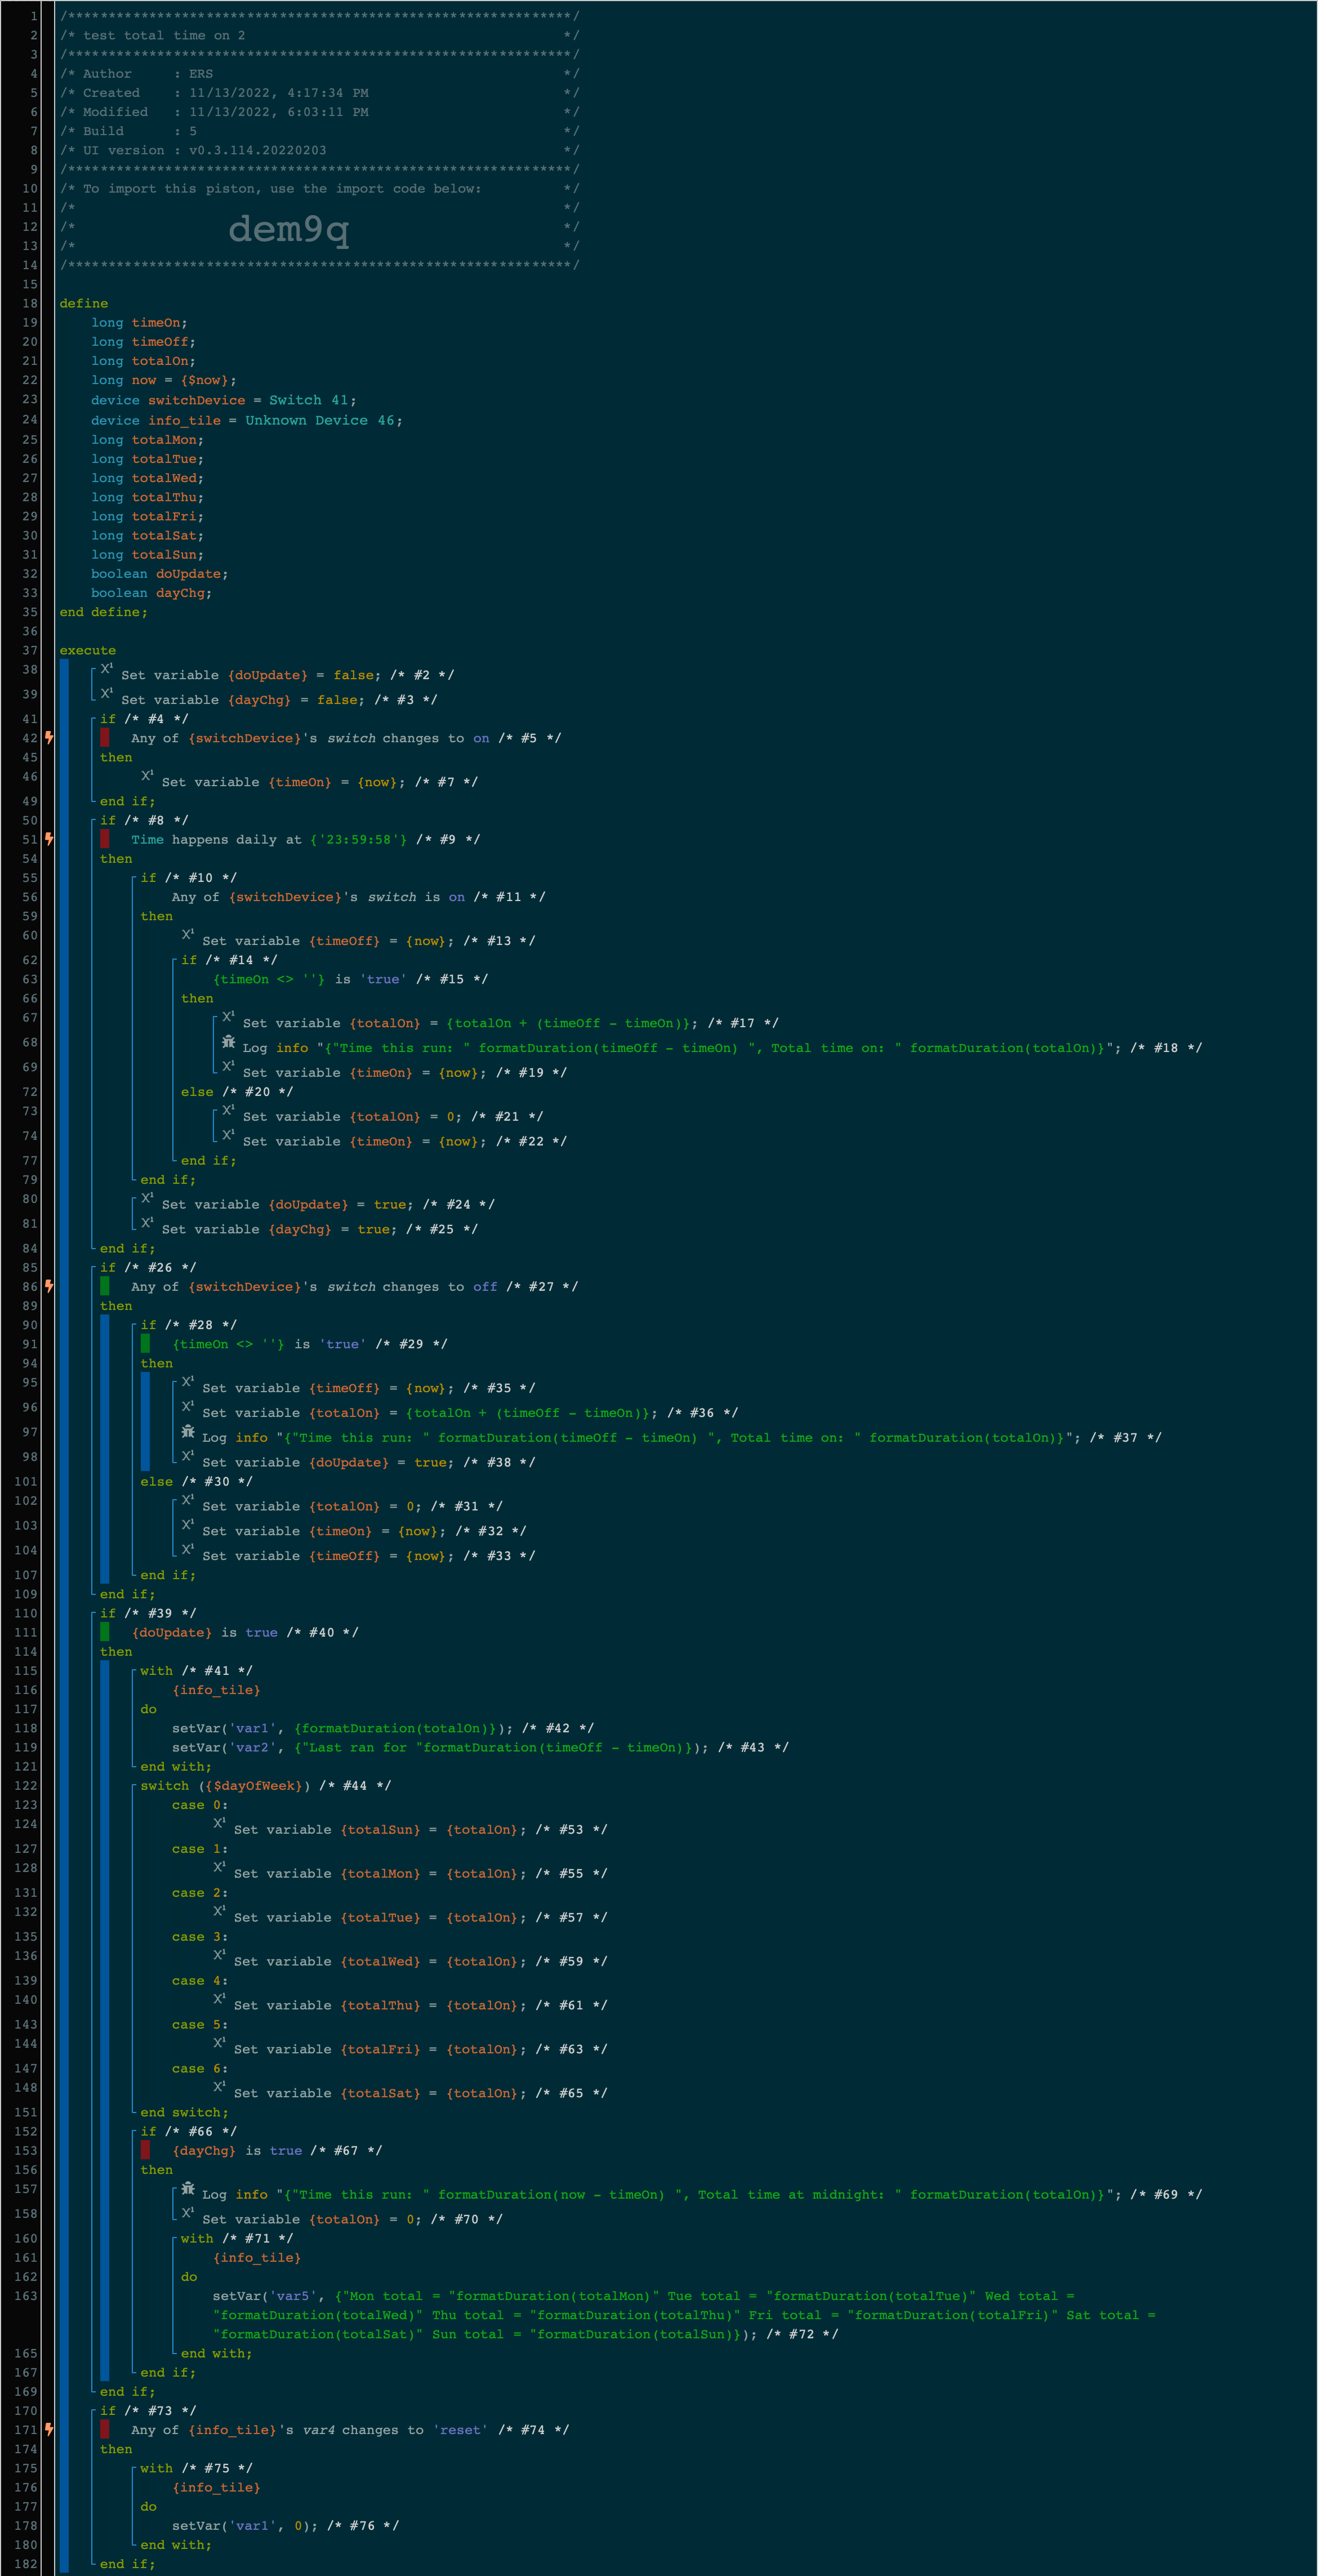
  • the total on today since midnight, in order to keep a daily total for mon, tue, wed… , which I’d like to log as var1 in the above pic. This currently half works, as the totals update after the switch has been flicked off - but I’d like this to periodically update whilst the switch is on (maybe every 5 minutes?) or, more accurately when the switch is actually flicked off
  • the duration of the last time it was on (this currently works fine, I believe, logged as var2 in the above pic

2) What is the expected behaviour?
as above
3) What is happening/not happening?
I’ve stolen bits of code from somewhere on here months ago, and for this use, is currently incomplete.

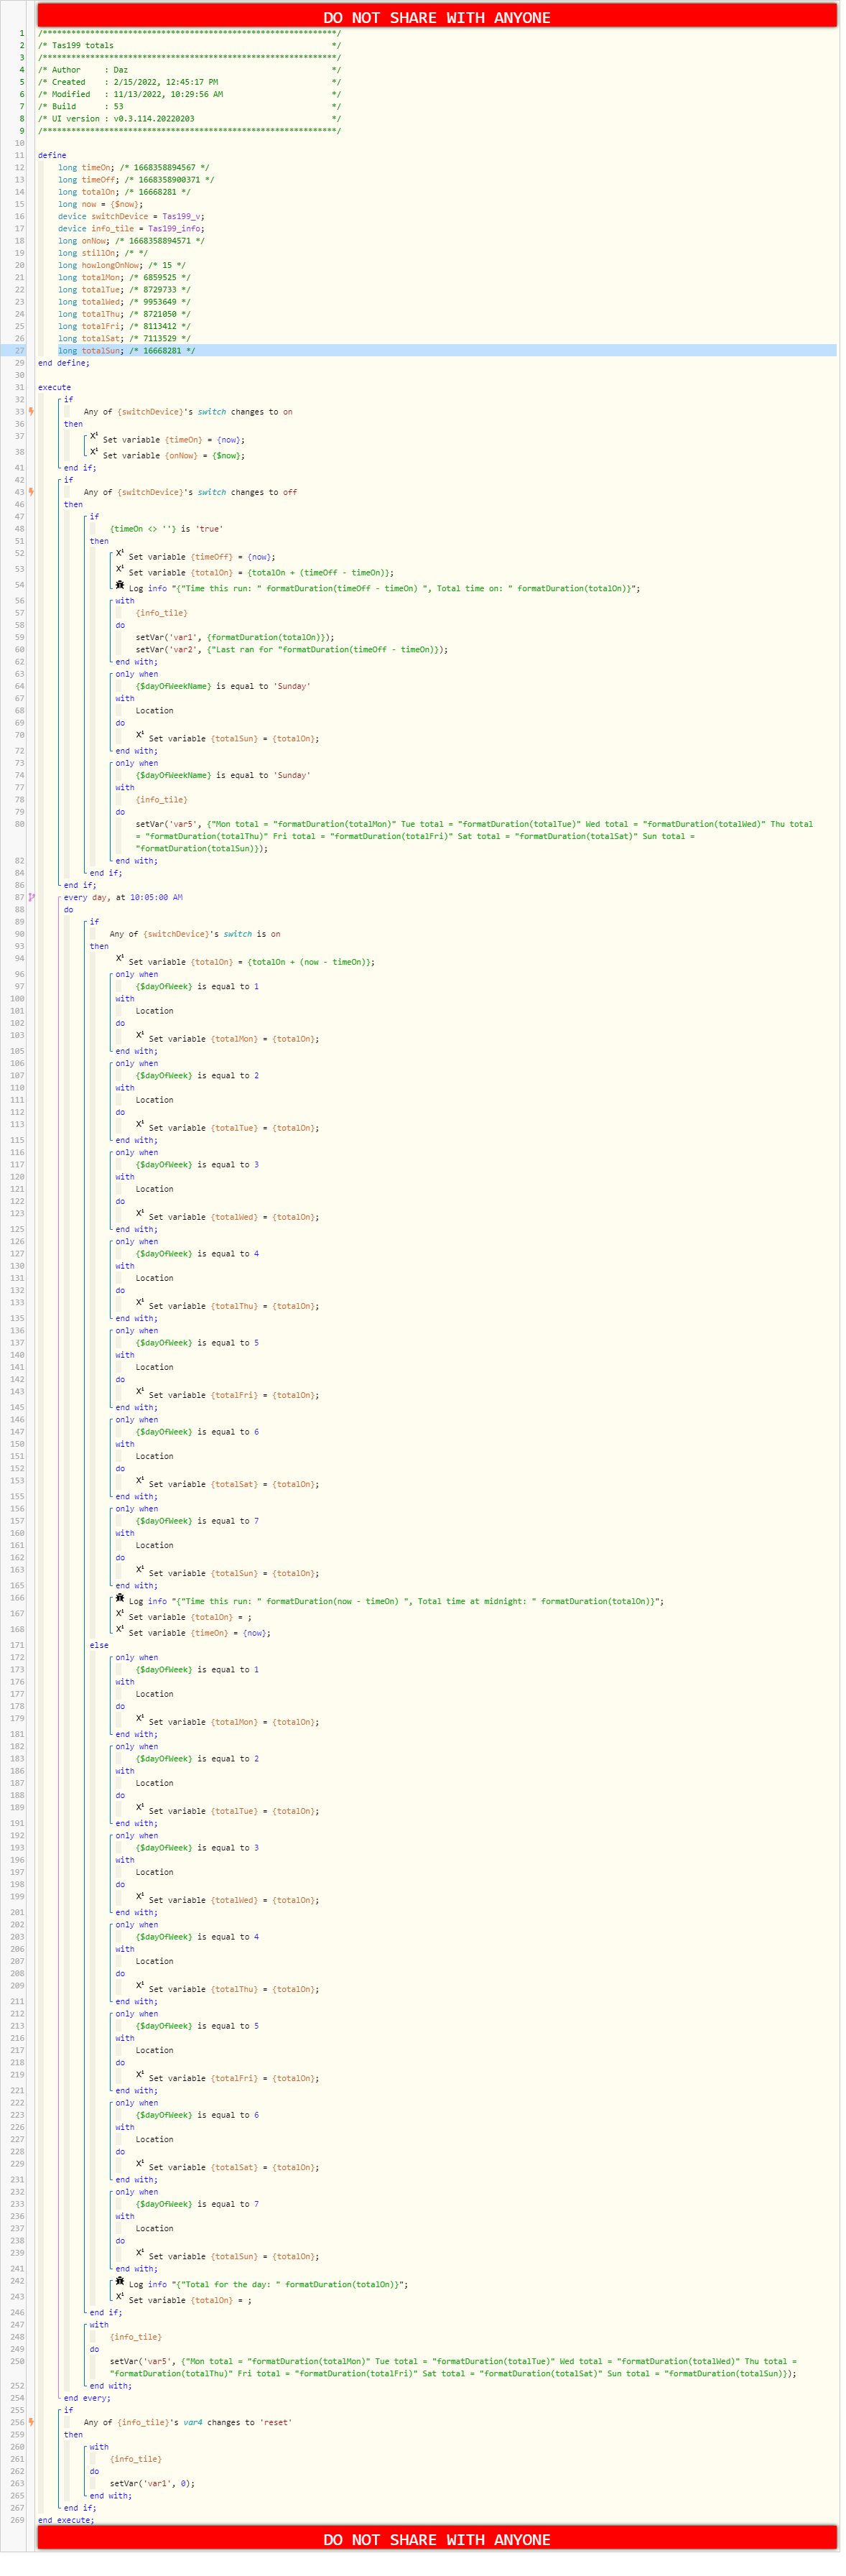
**4) Post a Green Snapshot of the piston

5) Attach logs after turning logging level to Full

n/a


Can Webcore totalize time a switch is on?
#2

you should post a green snapshot.

Are you trying to total for each day starting at midnight?

Do you intend to only monitor 1 switch per piston?


#3

Basically, I’d like to see a live running total time.

Also I’d like to be able to log this day by day.

Yes this is for a single device.

Purpose? Energy monitoring and other.


#4

can. you post a green snapshot?


#5

I did.


#6

So here is my suggestion


#7

Awesome
Ta!

I’ll give this a crack.

Ultimately I want to be able to collate data to compare week to week etc.

Haven’t quite got my head around how, but wondering if there’s an easy tweak which would allow this…


#8

I’m monitoring power over time, but am using nodered rather than webcore. nodered includes a gui interface with graphs and is quite easy to setup something like this. Its success depends on it being able to see your sockets. There is a link between hubitat & nodered you can use, it can also access the tplink tapo sockets I use, which hubitat can not directly see.


#9

If you put the data or summary data into a fuel stream, you can graph it on HE.

See:


#10

Would you mind showing an example please?

I’d actually initially thought more aong the lines of just being able to store a months worth of values, rather than graphs overwriting for the next month. I’d like to compare Monday to Monday to Monday. I’ll have a think once I’ve decided how best to tackle this before I come back with more specific questions.


#11

Graphs and data are two things I’ve never managed to get my head around to be honest. But thanks for the reminder.


#12

These are from my energy monitor on a rasp pi using nodered. The devices shown are all tplink tapo p110 switches which are polled by nodered every 5 mins. You could easily change the graphs to create weekly or monthly data.


#13

Cheers Paul. I’m going to need to eventually bite the bullet and go the raspi/NR route.


#14

Spot on - works. Thanks!

Next small issue - how to see the current run time. I. E. If the switch is on, how long has it been on for (current event). I guess this would need to run periodically, say, every 5 mins. Because at the minute say, if the switch has been on from 5 past midnight until 3am solid, the top value would only show the few minutes if may have been on between midnight and maybe 4 mins past.

I’d be happy if f the current cycle so far could be stored as say, var 3, then var 4 could be var1+3

Does that make sense?


#15

You can also run nodered on windows. I looked at nodered as an alternative to WC with the imminent switch of on smartthings. However for most automation tasks I prefer webcore (so have migrated to hubitat). I do think nodered is easier for the power monitoring and graphing and also can allow you to access some devices not available in HW/WC (eg tapo)

This gives an idea of the work required in NR to create the graphs shown above