Air Quality and Pollen Gauges

weather

#1

Overview:
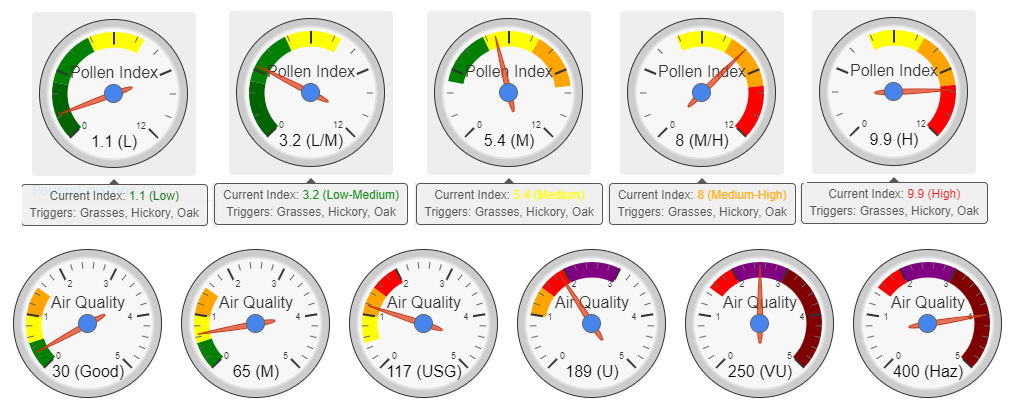
Displays AirNow Air Quality Data and Pollen .com Data in the form of a Gauges. These pistons are designed to dynamically adjust color references as the index changes given the current limitation of 3 colors in a given gauge.

Notes:
Virtual Air Quality and Pollen Sensor DTHs are required, ST forum discussion is found here:


The full smartApp is not required, only the two individual virtual sensors (and associated DTHs). GitHub links with install/registration instructions are found in post #2. The AirNow API requires (Free) registration to access the API.

The DTHs are designed to refresh data once every hour by default, using an “On Events From” trigger will update gauge data anytime the index value changes.

Implementation:
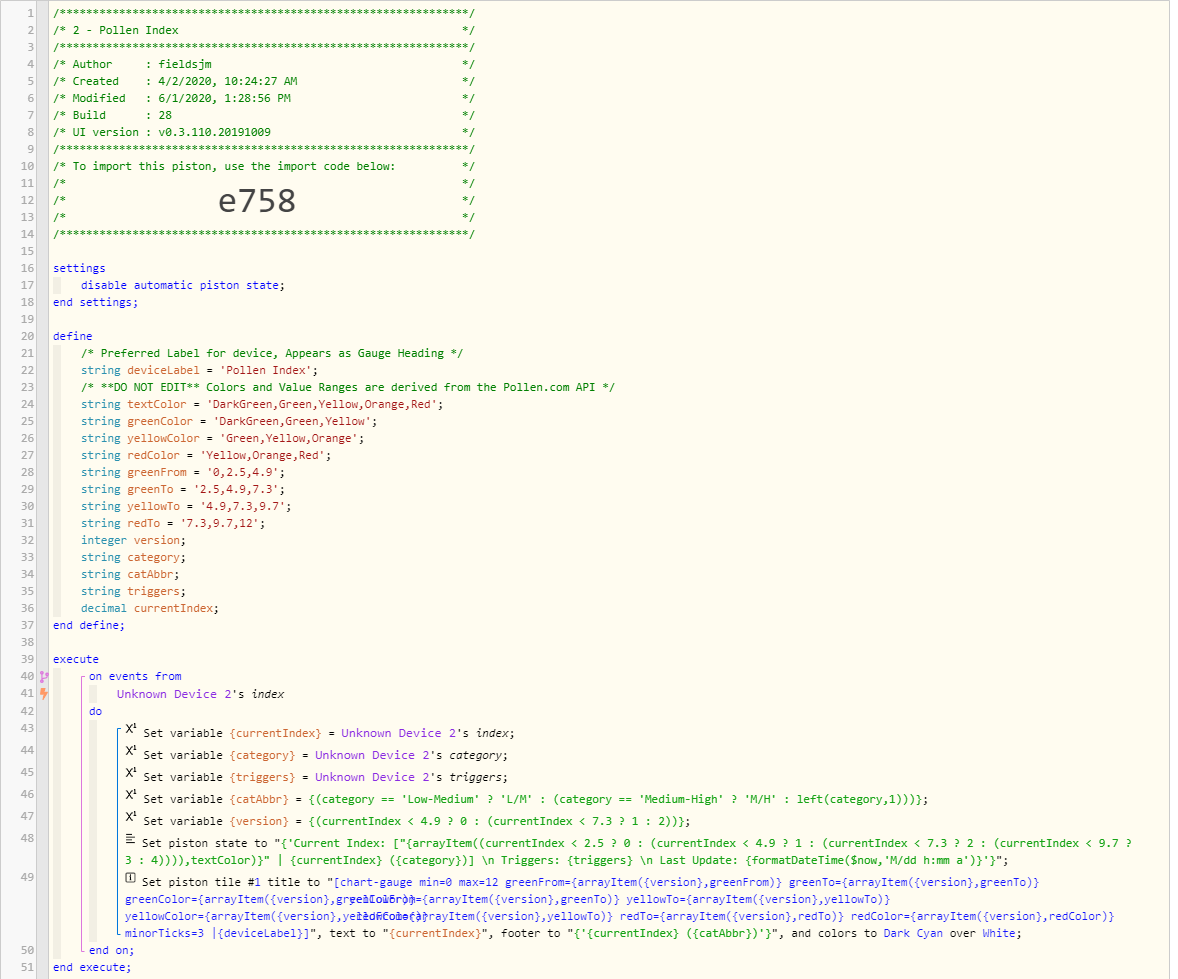
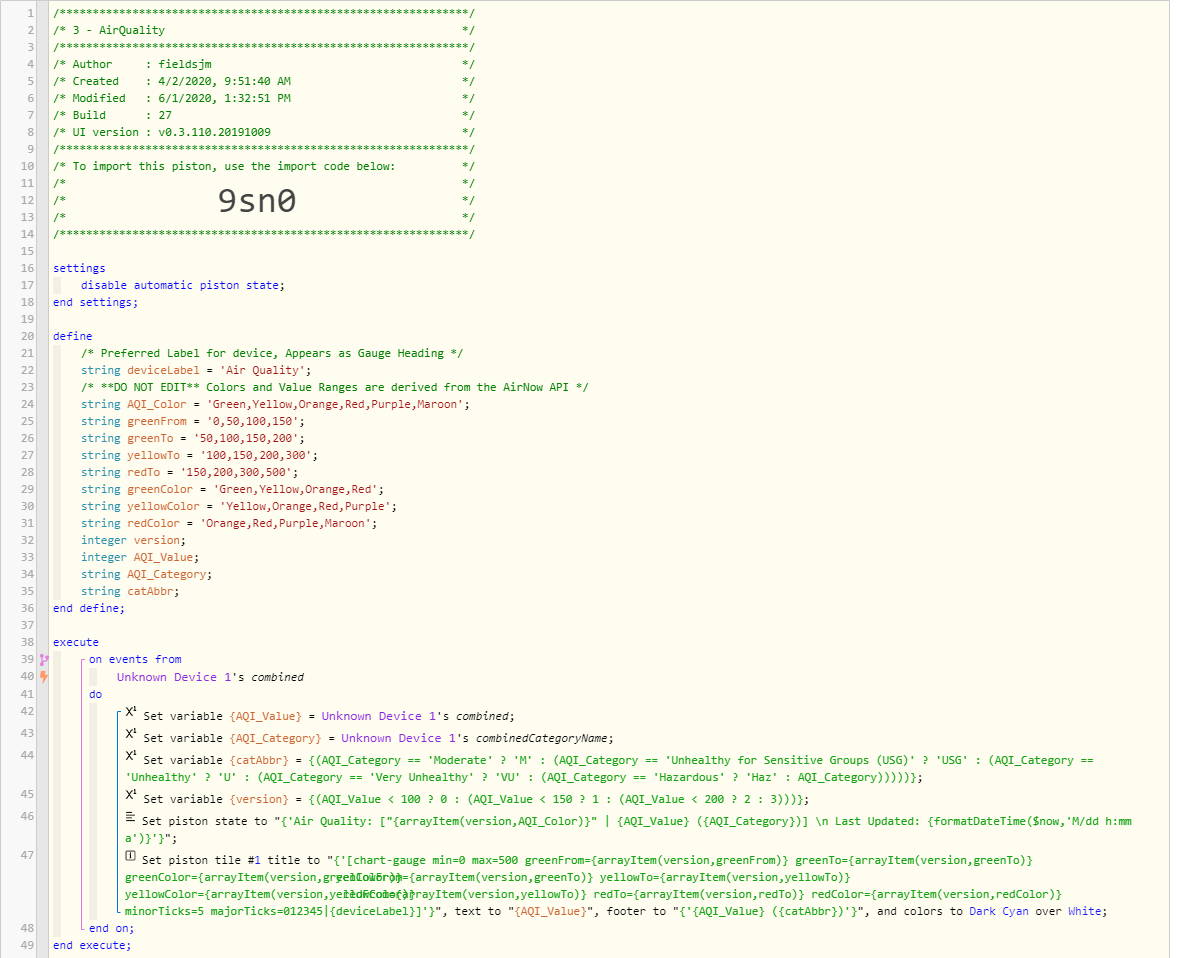
The pistons are designed to pull current data points from the DTHs and compare those to reference values from the respective APIs listed in array format.
The only adjustment required when importing each piston, is to assign the virtual device (Pollen Device/Air Quality Device) created with the DTHs above.


#2

I love the “rolling” colors in the background!! :+1:

Just so you know, even though we can only use three colors, you can break it down into 7 sections (5 colored + 2 white sections) if you are creative.


One note worth mentioning:
With this method, the two extremes will be the same color


#3

Thanks :smiley:

I did consider that and have used overlapping colors in other gauges but my goal with this one was to stay as true to the API colors as possible. Many individuals that track pollen and air quality (usually those with extreme allergies/health conditions) tend to correlate the colors with outdoor conditions.
And I just think it’s cool to watch the colors adjust dynamically :nerd_face:.


#4

Everybody,

These gauges look great, would love to add them, but I am having some problems. Not sure what I am doing wrong I am quite new to webCoRE.

I have created the virtual sensors and can see the data in the old SmartThings app (the new one just shows connected).
I added the sensors to WebCore from the SmartApp, imported the Pistons and selected the sensors right after import in the dialog asking me to update/rebuild.

I can click on “test” and the piston runs.
I added the pistons to a category and made sure it was set to Tiles/Details.

All I get is a line in my dashboard with the name of the Piston and when I over over it I can see when it has last executed (strangely I get two different values)


Any suggestions on what I should try to get this to work?

Thanks

Andreas


#5

Pushing Test will not draw the gauges…
(It has to run naturally for that to happen)

Depending on which piston you are referring to, it requires either an event from Device1’s combined, or from Device2’s index.


The lightning bolts (trigger ) in the left margin signify the events that will execute this piston…


#6

Thanks, that helps to understand how it works.

Just logged in again and the Air Quality gauge now shows up.

I will wait and see what happens with the Pollen Index gauge. From what I read on the description it should update once per hour, but there may be issues.
Will see if it works tomorrow, otherwise I may try “pollster” linked in the Read.me.

Andreas


#7

@WCmore is correct, you are waiting for an event to trigger the piston.

The device handlers request data once an hour but ST doesn’t register it as an event unless the value changes. Changes are very random and occur more frequently with air quality. Early morning is usually a good bet for pollen to update. If still nothing tomorrow, I can recommend some adjustments to get it going.

Once they’ve sucessfully run after an event, you should get summary data when hovering.

This is expected for now, hoping ST is able to port all my favorite custom handlers into the new app eventually.