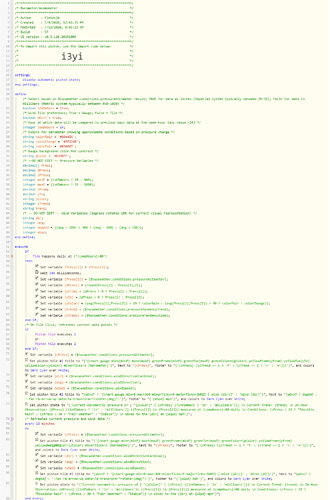
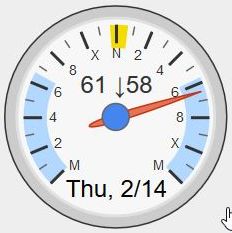
Just for fun, I put together a piston that draws two gauges. One is a representation of a Aneroid Barometer and the other is a simple Anemometer displaying wind direction and speed.
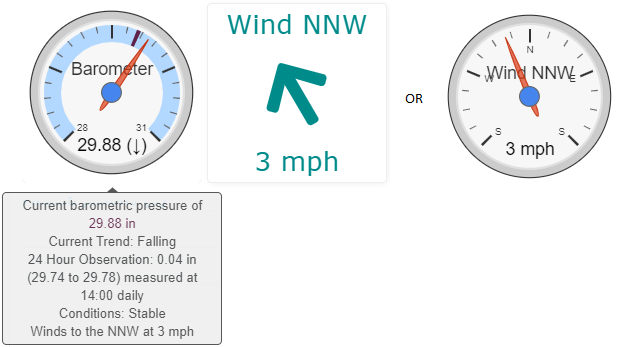
All data is pulled from available $twcweather data so accuracy will be dependent on your location relative to the weather station.
Most physical aneroid barometers will have a second needle, which serves as a reference point to compare pressure across two time points, typically 24 hours apart. Unfortunately, we are limited to only one needle so a reference range is drawn into the background color of the gauge to represent a 2nd needle.
In the above screenshot, the range is very small and relatively similar to current pressure so it is hard to see. (Which means I should not be experiencing any changes in weather patterns  ). If you’re interested in the background of barometeres, this is a neat website https://www.artofmanliness.com/articles/fair-or-foul-how-to-use-a-barometer/.
Piston Implementation:
Required Settings
- $twcweather barometric pressures will be reported in either inches or millibars (as far as we know) depending on location. The gauge can handle either but needs to be calibrated. Set the inVSmbars boolean to true for inches or false for millibars. (To determine what data you receive, use the evaluation console to pull the following expression: $twcweather.conditions.pressureAltimeter ; result will be either in the range of 28-31 [inches] or 950-1050 [millibars]).
- compHours is the time in which you want to use for your comparison (in 24 Hour). Ex. 14 = comparing data daily at 2:00pm
- Due to the built in reference range, piston must execute the 24 hour timer twice to save the data for your location. In the meantime, you may see errors/unusual colorings on the gauge.
- Wind Gauge: set wGvsT bolean; True = Gauge, False = Tile
- Hitting test will draw the initial gauges without the reference data (which is updated every 10 minutes). Once the gauges are drawn, you can click either of them to refresh the current data.
Update: 7/12 - Editing colors with a lighter background for readability based on @WCmore’s suggestion in post #4.
Update 7/13 - Adjusting wind gauge to capture full spectrum of values; Added an option for a simpler tile format. See post #5

