
I will ask Terry at ActionTiles to comment here. Thanks.
Daily countdown of days to event that will display on ActionTiles

Pantheon
#10
Anyone have any new ideas on how to display a “value” tile in Actiontiles? I just want a tile that displays a number. I can add the name of the tile in Actiontiles, such as “Days until Disney”, if I can find a method to only display a number.
WCmore
#11
Unfortunately, I have not encountered any “built-in” programming that displays a number without also including extra stuff in ActionTiles… (degrees, lux, on/off etc)
If there is ever found a solution over in this thread, I think that will be your best bet for ActionTiles.
For what it’s worth, when it comes to customized displays, the Dashboard here in webCoRE is far superior to ActionTiles. Whether it is purely textual, a color changing tile, or even a gauge.
I think your piston can revolve around the “Day of Year” for all of these iterations.
![]()
(returns a number from 1 to 365, or 1 to 366 on leap years)
WCmore
#12
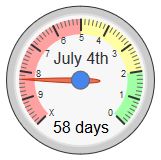
The gauge shown above is something I threw together real quick to give you an example, and maybe some inspiration.
It counts down 70 days (ten weeks) leading up to any event.
(currently 8 weeks and 2 days away)
I used this calculator to find the {eventDay} number.
WCmore
#14
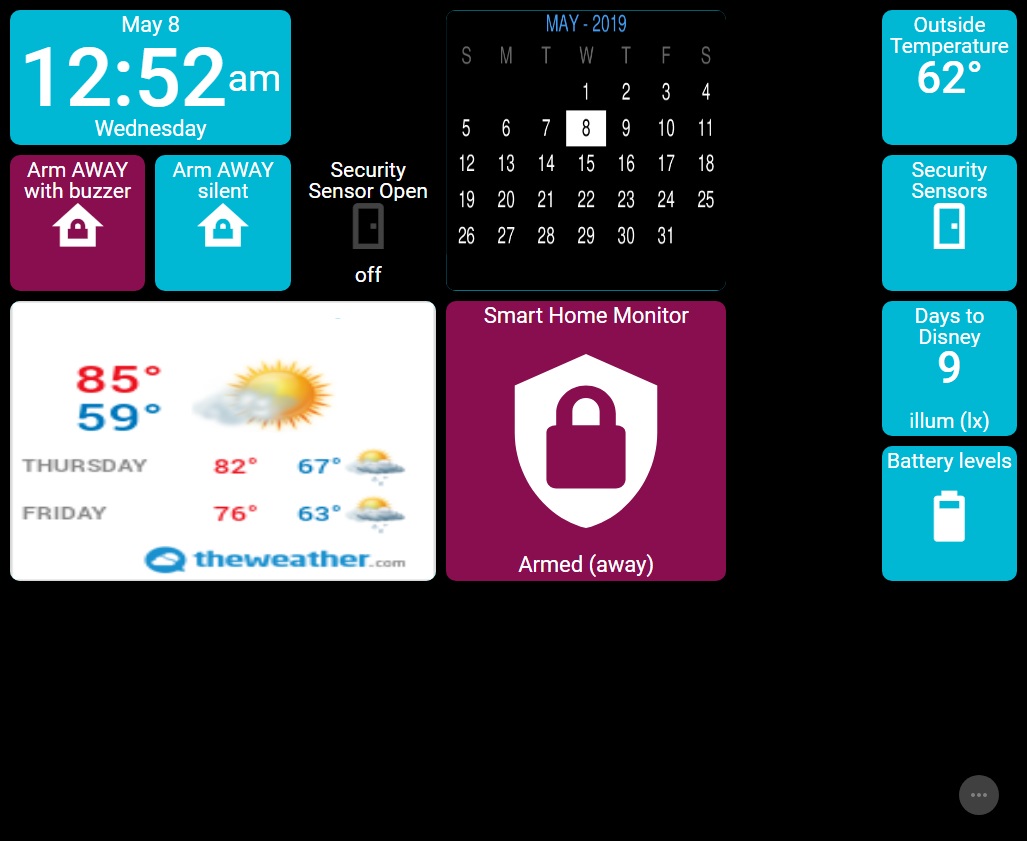
For the most part, yes, and much better. To be fair, I have not seen a calendar exactly like that in webCoRE, but I have my own calendar on my Dashboard, so it is possible. Also, there are only 6 sizes of tiles in webCoRE (compared to 9 in ActionTiles)
Strengths for ActionTiles are:
- Interactive display
- Quick update to device’s status
- Easily sharable so different panels can be visible for different reasons/people
Strengths for WebCoRE’s Dashboard are:
- IF logic changes the display at anytime
- Image based tiles (thousands of icons available, compared to 50? in AT)
- Gauge tiles for easy data viewing
- Textual updates (can be very long text)
- Unlimited gradient colors for text/background such as cold/blue fading to red/hot. (AT has 4 color choices)
In general:
- I use ActionTiles in places where I want to touch a button to do things…
- I use webCoRE’s Dashboard when I want to see a bunch of information
(both platforms can do both, but are seriously crippled in the opposing category)
In conclusion, I like and use both programs for very different reasons.
The perfect world for me is a web browser that can display both dashboards side-by-side
(such as the plugin for Firefox called Tile Tabs)
Pantheon
#15
I am vaguely familiar with webcore dashboards. But now you have opened up another area of experimenting/research for me. Let me dig in here and see what I can find. Thanks @WCmore. I am sure I will have questions.
eibyer
#16
I have an idea for a multi-step process but I don’t have time to mock it up at the moment.
Use a placeholder service, similar to, placeholder.com (background and text can be manipulated, see site for instructions)

The image above was generated from url: https://via.placeholder.com/100.png?text=8
You can make webcore make the call daily to generate the image and use any local device that is on 24/7 like a pi (seems like everyone has one) to wget the image and rename it to something static that AT can use as a media image 
Tada! lol
WCmore
#17
Thanks for sharing @eibyer!!
I got really excited when I saw your post, thinking it was a solution to my old problem.
Unfortunately, I could not find a way to make the text span more than one line, nor to increase the font size. 
For example, the ideal tile size in webCoRE is 78x78 pixels.
If I only need a character or two, it looks good:

…but if I make the display 6 characters long, it’s barely legible:

…and a straight disaster with 10 characters:

I do like your idea though if we only need a character or two to be displayed in ActionTiles.
By the way, the code for those three images are:
https://via.placeholder.com/78.jpg/BFEEFA/0000FF?text=1d
https://via.placeholder.com/78.jpg/BFEEFA/0000FF?text=1d+18h
https://via.placeholder.com/78.jpg/BFEEFA/0000FF?text=12d+18h+24m
eibyer
#18
Ah, sorry dude… I was only thinking about numbers lol. There are quite a few of the placeholder sites though so one that has a shrink-to-fit feature might be available.
eibyer
#19
This one is readable but not sure if it suitable to your project. https://imgplaceholder.com/
https://imgplaceholder.com/78x78/1e1919/f32626?text=1234567890&font-family=impact

Edit: I like this last one… it supports _br_ (break)
Edit2: Did I mention I like this one?? Lots of customizable bits that can be modified via variables in webcore and feeding it into the url.

Simulated Power Meter device handler
WCmore
#20
Oh yes! And adjustable font size!

https://imgplaceholder.com/78x78/d6edfd/4047ff?text=26+days_br_until_br_Disney&font-size=21
I am definitely going to bookmark this one. Thanks!! 
Trying to Pass an attribute from PurpleAir device barometer to a Virtual Temperature Sensor
eibyer
#21
I use the same basic process for my bloomsky image, ifttt downloads new images and I have another process that renames it and upload it to my webserver where AT picks it up for display.
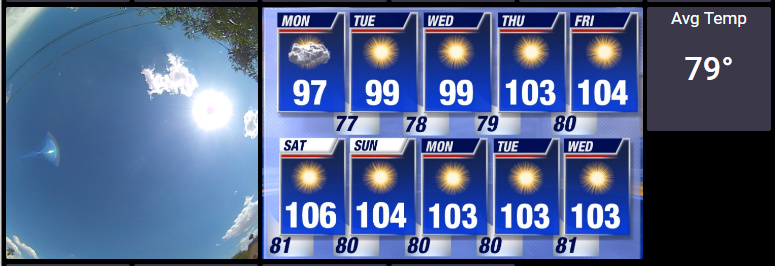
Note: Image is old, we’re not burning yet in AZ
WCmore
#22
I gotta say @eibyer, that sounds like a great new thread for the Example Pistons category!!
(Edit: didn’t mean to put you on the spot… I just realized all of the coding is done outside of webCoRE)
That being said, there are sooo many applications that this can be useful!
lrargerich
#24
One option is to use a small Python script to dynamically create the png file.
from datetime import date
from PIL import Image, ImageFont, ImageDraw
import datetime
from PIL import Image, ImageFont, ImageDraw
if name == “main”:
im = Image.open(‘Luis.jpg’)
font = ImageFont.truetype(“arial.ttf”, 20)
draw = ImageDraw.Draw(im)
d0 = datetime.date(2008, 8, 18)
delta = datetime.date.today() - d0
txt = str(delta.days) + ’ days’
draw.text((7,129), txt, font = font, fill=(255,255,0))
im.save(‘counter.png’)
You need a plain jpg file with the background color you want (in my script Luis.jpg.
The script creates the counter.png file that you can then display in action tiles.
Of course you can schedule this script to run every day to update in a linux box you can just put it in crontab.
Eventually this can be used to create any tiles you want. I use it with life360 to create a Location tile saying where my family members are.
Pantheon
#25
You guys rock! Yet another option for me. I don’t know Python, but I have been wanting to learn. This will be a good starting point for me I think. Thanks to all of you.
WCmore
#26
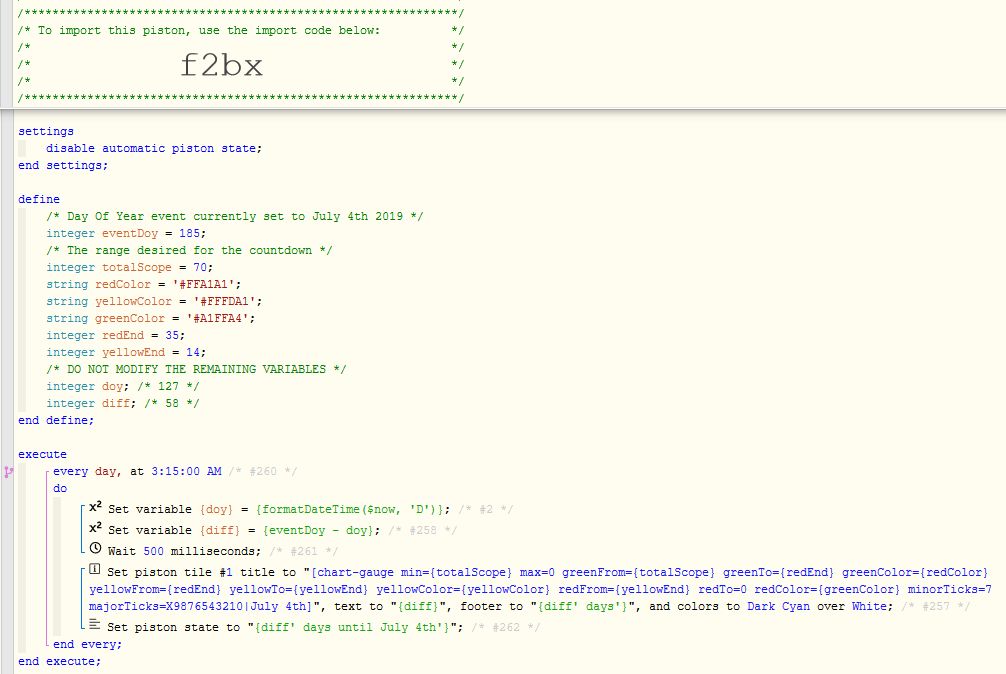
This thread has inspired me to create a piston that displays a countdown to any event on the webCoRE dashboard. (unfortunately, it will not display in ActionTiles)