Got it, thanks.
Gauge Tiles & Piston State Display for Energy Reporting Devices
How do you clear all data to start over? I have a Gen 1 Aeon Labs meter with version 3.67. Thank you
You should be able to do this by selecting the device in the SmartThings app. I use a custom handler but I’m fairly sure even the stock handler has a reset option.
Not only is this really great work, but on the part of @ady624 I had no idea webCoRe had such capabilities. This is awesome!!!
Hi Nezmo
is there any way to have gauges display out side of webcore dashboard like to a device on my local network?
thanks
If you have access to a server, you can write PHP code to process data from webCoRE and draw whatever you like.
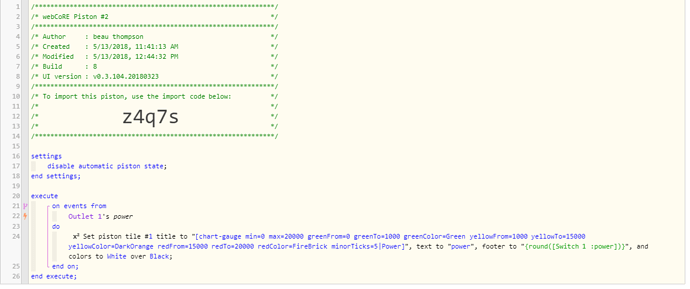
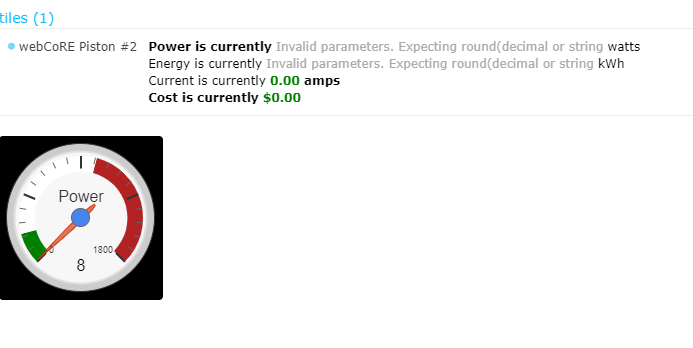
in the “text to” section, you need to point it to the number or variable that contains the number to display the needle.
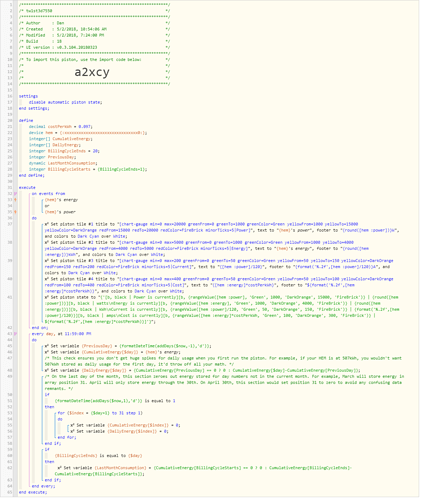
For anyone looking for a way to monitor daily and monthly usage, I created this piston for another member here. You set the date your billing cycle resets, and webCoRE will store a sliding 1-month window around that date.
hi nezmo is the any problem have two sets of gauges on one instance
what settings do you use for gauges and color coding to something more applicable for a single appliance.
If you mean once instance of webCoRE, no, no problem with that. I have many pistons in a single webCoRE instance that generate gauges for different purposes.
I’m not clear what you are asking. Color coding is purely the user’s choice. Not sure what you mean about settings.
What i was asking is
the tile code [chart-gauge min=0 max=1800 blueFrom=0 blueTo=300 blueColor=Blue yellowFrom=200 yellowTo=1000 yellowColor=white redFrom=1000 redTo=1800 redColor=FireBrick minorTicks=5|Power]did you
code that by had or is the a tool to help and what options are there
here what i am trying to do
Blue = 0 – 300
Cyan = 300 – 600
Green = 600 – 900
Yellow = 900 – 1200
Red = 1200 – 1500
Purple = 1500 – 1800
By hand. The values and colors are all the user’s choice. Just put it what you want.
However, you are restricted to the number of colors in my code. You can’t split it up in to the 6 colors you want.
Well, technically, 3 colors is the limit, but you can cheat a bit by leaving a couple of sections blank to create white like this:
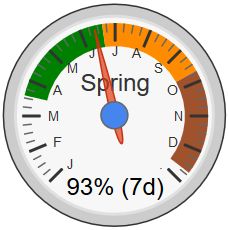
Also, if you overlap the colors, you can actually create 5-7 colored sections like this:
(5 shown below, but you can make 7 if you allow white to be the high & low)
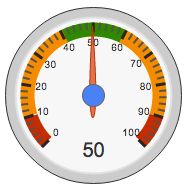
In the example above:
- greenColor = Red (0-100)
- yellowColor = Orange (10-90)
- redColor = Green (40-60)
(Example code found here)
@michicago I’ve been using your version of this piston (great work!) and it’s been working nicely for the past month. I set my billing cycle to end on the 20th so now that it’s a new billing cycle, I thought the cumulative cost would reset to zero. Any suggestions for why it has not? Thanks
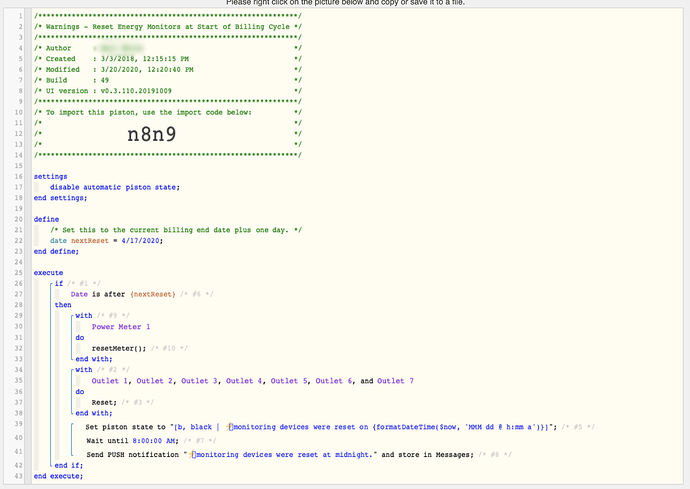
This piston is not set up to do the actual reset. You need to add code for that or do it elsewhere. Here’s a piston I use to reset all my energy reporting devices:

 .
.