
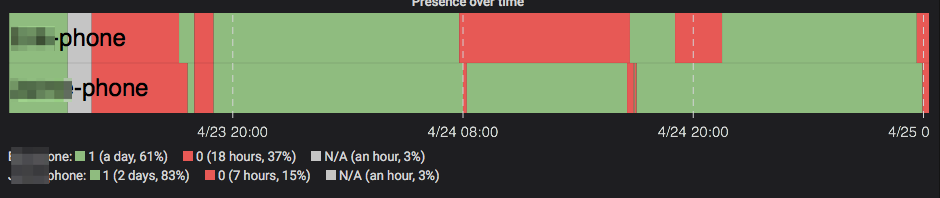
Using my webcore proxy (https://github.com/edasque/Webcore-Proxy) and Grafana, I’ve be able to set up a nice presence grab as well as presence annotations on other graphs. I thought you’d find this interesting, happy to go into details on how this is set up, beyond the README.md:
Graphing Presence
ferik
#3
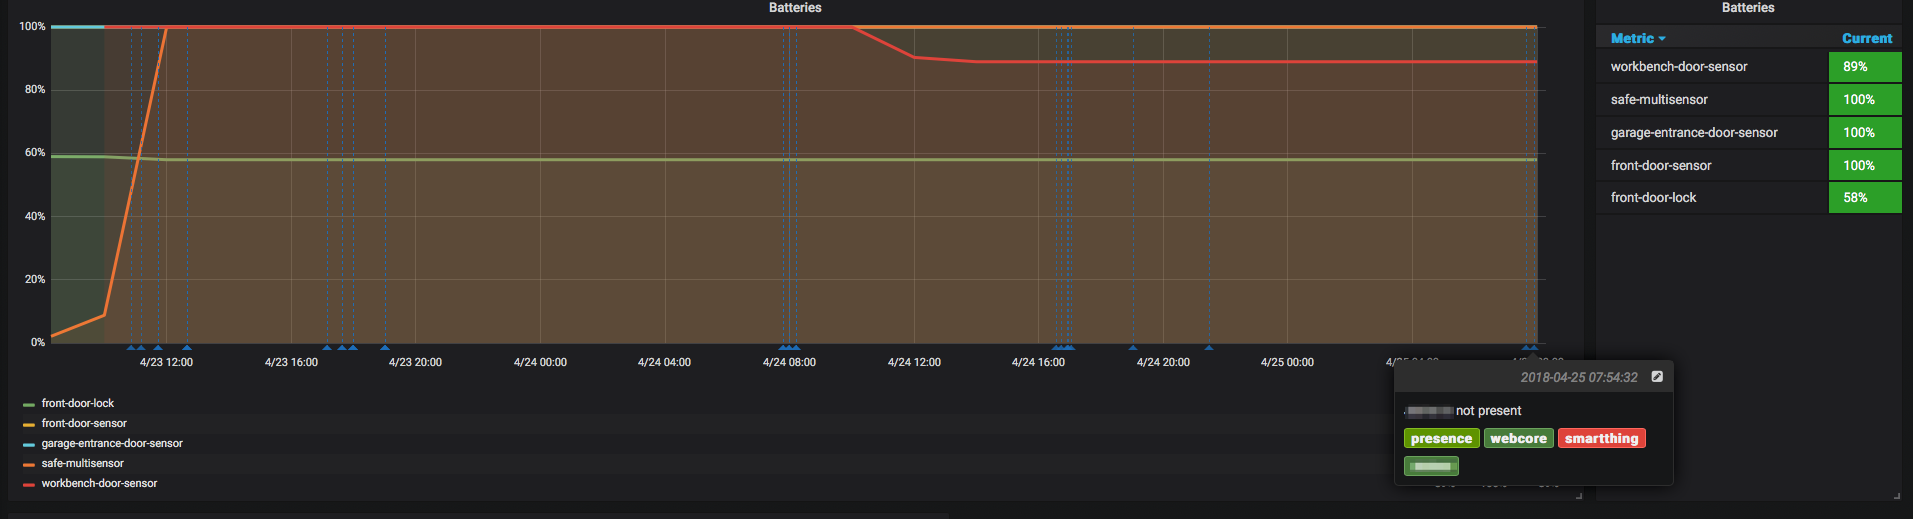
What I built can be used to graph anything within webcore and create annotations on these graphs. I find it very useful for measuring battery, temperatures, see people coming in and out, etc.
The imagination is the limit.
WCmore
#4
Man, I am a fuel-stream-junkie, with 34 active graphs at the moment.
(38 if you count the ones on my dashboard too)
Does your method require a PC to be left on 24/7?
allrak
#5
Yes, it does. I’m currently trying to get this functional using a raspberry pi, which just sits in a closet and runs 24/7.
ferik
#6
That’s correct. I run all this in Docker containers on my NAS which is not much more powerful than a raspberry Pi. A $30 RPi 3 could do the job nicely, for sure.
milhouse
#7
Pfft. Amateur. 
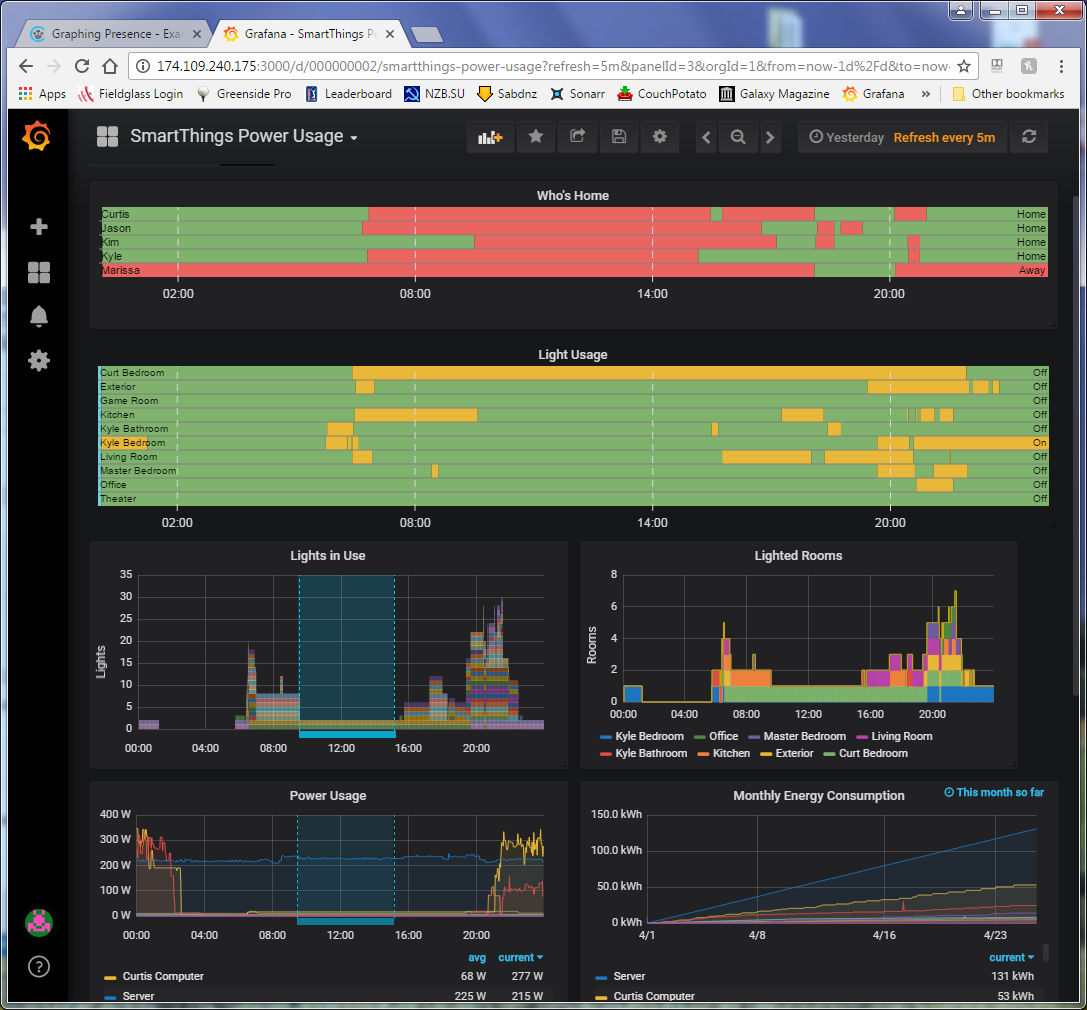
I have webcore pistons that create annotations for washer done (on the power graph), dryer done (a multipurpose sensor temp graph), and an annotation range for when no one is home. E.g. can see how much power usage or lights are on when no one is home.
I have other Influxdb/grafana dashboards for ecobee data (pulled through python scripts), raspberry pi collectd data, and network useage (scripts on the AsusWRT router).
Don’t get started on this - it’ll consume you! 
J
allrak
#8
So I got @ferik’s webcore-proxy working. Took me awhile as I’m new’ish to using nodejs/npm.
Didn’t realize that statsd had to be already running. (doh!)
Also used PM2 http://pm2.keymetrics.io/docs/usage/quick-start/ to start everything up and keep it organized.
So for anyone looking for more info, pretty much had to get these installed:
graphite-carbon
graphite webapp (wsgi module)
grafana
nodejs + webcore-proxy + statsd
PM2 for starting/stopping (optional)
I’m running all this on a raspberry pi 3 B+
ferik
#9
Milhouse,
good job, we’ve been doing very similar things. It’s funny that we ended up with a very similar presence graph without consulting each other. How do you send the presence, as a gauge? I use 0 and 1 for gauges, how do you have Grafana show them as Home/Away?
Though I have to say, you’re the amateur, I don’t see any annotations in your Grafana dashboards. Weak sauce 
ferik
#10
@milhouse another question. How do you get data from Webcore into Grafana? Did you do the same as me and wrote a proxy to translate the POST call into a influxb call? Or are you able with InfluxDB to directly POST from Webcore (statsd & graphite don’t have a RESTful API for pushing data AFAIK). If the latter, I might switch to InfluxDB
milhouse
#11
I am using the InfluxDB Logger smart app https://github.com/codersaur/SmartThings/tree/master/smartapps/influxdb-logger
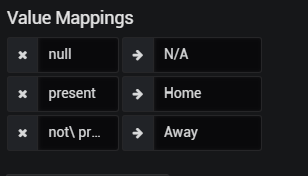
to log from SmartThings directly to my InfluxDB database. Data comes in from the presence devices as text:
time deviceId deviceName groupId grou
pName hubId hubName locationId locationName unit v
alue valueBinary
1508414001405276600 0312ddbc-1e8f-4891-a601-9b14c4175d3f Jason null Home
null null f6b34707-34b7-45cf-bc09-606788efa347 Home presence n
ot\ present 0
Then I use mappings in Grafana to pretty it up:
Oh - and I do have annotations. The blue bar under the “lights in use” and “power usage” are range type annotations. And point-in-time for things like “washer finished” which isn’t in the current time range.
milhouse
#13
Happy to. Not sure of the best way for you to make use of it, though.
Save dashboards to JSON file?
Share link? I think you’d need a login.
Snapshot? (Discrete panel doesn’t seem to work on snapshots)
Heck, PM me with your email and I can even make you a viewer login.
You tell me what format you’d prefer.
milhouse
ferik
#14
If you only have a few, maybe saving as a JSON file is best? That way others can benefit from it? @milhouse
milhouse
#15
Can’t attach it here, seems to only accept image files. Here’s the text of the JSON. I have only one dashboard for SmartThings. Other dashboards are network (router scripts + sabnzb), raspberry pi (collectd), and thermostat (ecobee scripts). I can attach those if there is interest, as well.
I’ve never tried to use someone else’s Grafana dashboard, am curious how useful it is.
Published snapshots here, too. It’s a shame the discrete panels don’t work on the snapshot. They’re my favorite. Nor do the time overrides - I have several panels that are month-to-date.
https://snapshot.raintank.io/dashboard/snapshot/Wtu0EM4EJ1lH11BMAeJcnOzypK1OKIlO
https://snapshot.raintank.io/dashboard/snapshot/NdGYNUZjP7j1bqawDOy1arIUM0KQ41mg
https://snapshot.raintank.io/dashboard/snapshot/FAJXxKuhhH6b3JqSeKeSfBxRm5a50Jui
Let me know if you’d like more detail. As I said, happy to give you a read login if you PM me.
milhouse
edit: removed the badly formatted JSON. Here’s a link on my gdrive:
https://drive.google.com/file/d/1TgssuLdKEpFZ-BSwTtYmZcj7ZYukZRVV/view?usp=sharing
ferik
#17
@milhouse - the forum did a number on the JSON file. I tried to fix it by hand but there were hundreds of issues.
Could you send it via https://send.firefox.com ?
Or maybe escaping the text with a markdown triple-` would work?
like so
milhouse
#18
Edited post above - just shared from my Google drive. Firefox share didn’t seem to work, and would expire in 24 hours anyway.
Hopefully this version will work better!
milhouse
ferik
#19
Awesome, I was able to use that and a few panels I hadn’t thought of. Thanks for turning me onto the InfluxDB logger (makes me want to learn how to build my own smartapps), saved me a lot of pain and manual work, @milhouse
milhouse
#20
Glad it’s of use to you! Yeah, that InfluxDB Logger smartapp is really easy to use.
Post some pics of your graphs when you’ve got them, especially if you’ve got any unique ones I haven’t thought of. Mine are all a bit of a dumping ground to see what I can do with Grafana and the data I’ve got. Not all are useful.
Let me know if you are curious about any of my WebCore pistons that actually post the annotations to Grafana.
milhouse