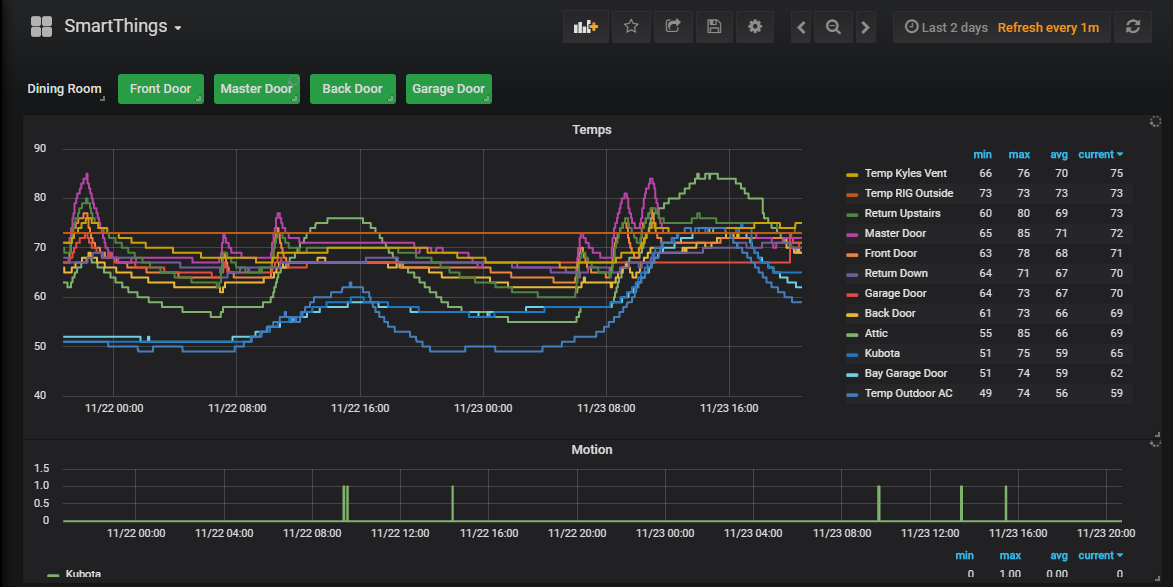
Can’t attach it here, seems to only accept image files. Here’s the text of the JSON. I have only one dashboard for SmartThings. Other dashboards are network (router scripts + sabnzb), raspberry pi (collectd), and thermostat (ecobee scripts). I can attach those if there is interest, as well.
I’ve never tried to use someone else’s Grafana dashboard, am curious how useful it is.
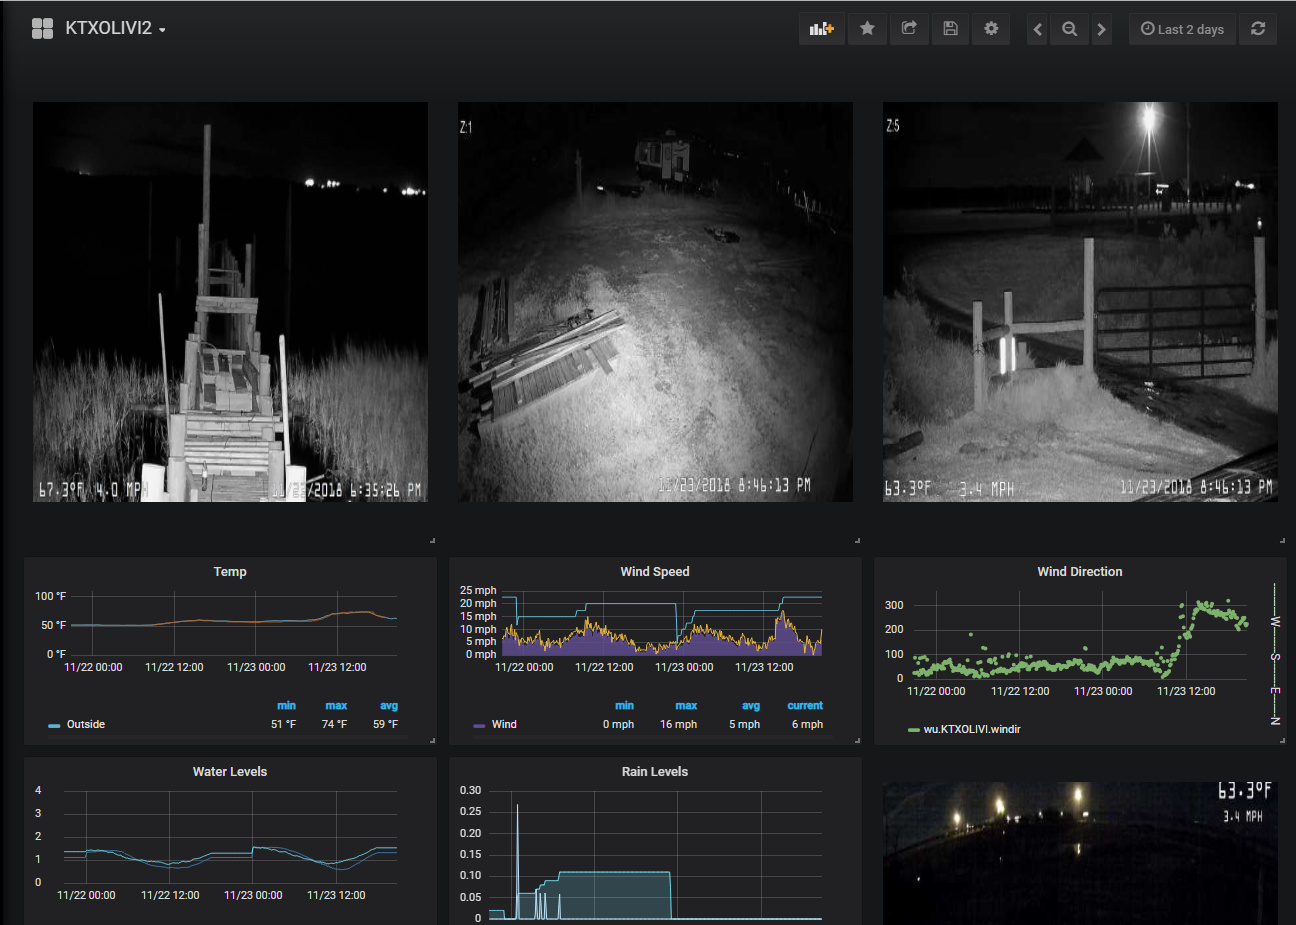
Published snapshots here, too. It’s a shame the discrete panels don’t work on the snapshot. They’re my favorite. Nor do the time overrides - I have several panels that are month-to-date.
https://snapshot.raintank.io/dashboard/snapshot/Wtu0EM4EJ1lH11BMAeJcnOzypK1OKIlO
https://snapshot.raintank.io/dashboard/snapshot/NdGYNUZjP7j1bqawDOy1arIUM0KQ41mg
https://snapshot.raintank.io/dashboard/snapshot/FAJXxKuhhH6b3JqSeKeSfBxRm5a50Jui
Let me know if you’d like more detail. As I said, happy to give you a read login if you PM me.
milhouse
edit: removed the badly formatted JSON. Here’s a link on my gdrive:
https://drive.google.com/file/d/1TgssuLdKEpFZ-BSwTtYmZcj7ZYukZRVV/view?usp=sharing