Memory used calculation


#1

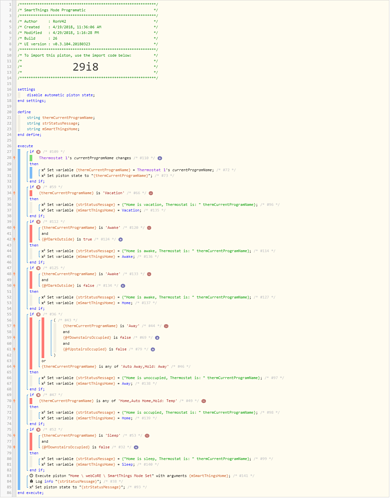
Here is one that has me confused. I have been tweaking a Piston for a while that works with setting the SmartThings mode based on the mode of my Ecobee thermostat. Yesterday when I opened it up to memory showed 87% utilized for this simple piston and couldn’t think why.

I decided to edit a new piston just for fun and rebuilding it from scratch line by line though the UI and when I got done it’s memory utilized was only 65%. And both pistons were duplicates, one was edited over time and the other just re-entered.

Is there any reason why this would be? Since we don’t get to see what is gong on behind the scenes is there any “garbage” to use a JVM term that isn’t cleaned up when editing and saving a lot? Also is there any documentation (checked the Wiki) that says what statements or elements consume the most memory?

Thanks.


#2

It may be the Piston’s log. Over time, it can eat up a bunch of memory. Try clearing it and then see how much memory you reclaim.

I tend to set the level to none once I have the Piston working.


#3

Also, when making variables like you did, they take up no room until after it runs. Then the variables populate, so they take up space.


#4

No logging, the new piston is still holding memory at 65% after 3 days of running so there goes the theory or variables, and the log.


#5

Variables and logs taking up space (once used) is not a theory. They both do. Just keep in mind that although logs will automatically get overwritten/deleted to make room if needed, the variables do not.

My theory is you didn’t notice a change because you only have 3 variables, and from my quick glance, only about 50-100 bytes of data are stored in your variables once the piston ran. (It takes about 1000 bytes (1K) to signify 1% Memory used).

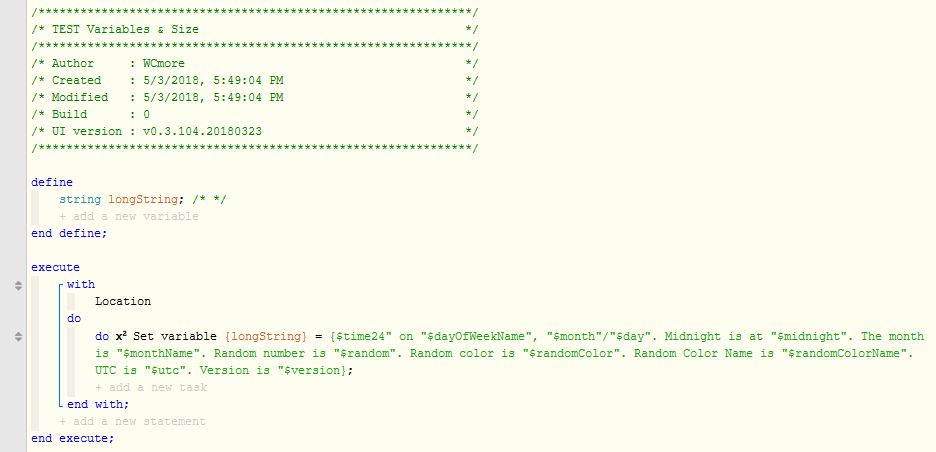
I did a quick test to show the variables taking up space. First pic is a blank variable (piston that has never ran)

With the size of:

size2

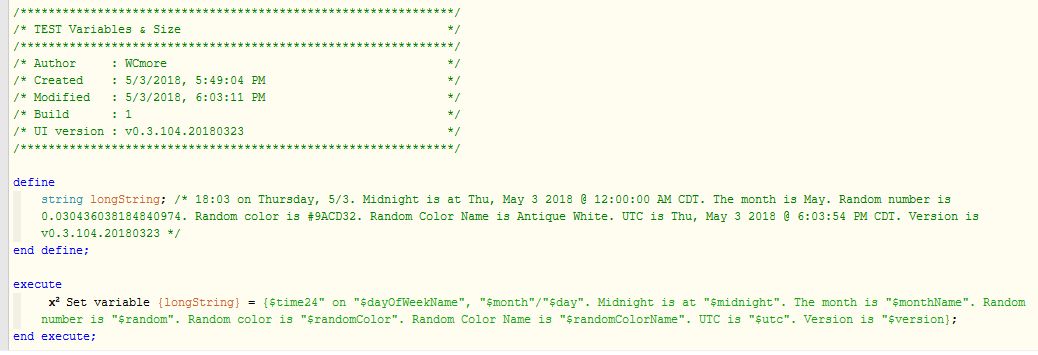
I run it once to populate the variable:

And the size increased about 21%:

size4


#6

Well, I’m now convinced.


#7

I know that variables and logging take space but seeing such a large gap between the two pistons questions what actually takes up the memory. Both are identical use the same variables and no logging. I am so used to being able to debug on a code level and seeing the behavior in the JVM etc that anomalies make me question what is actually going on.

Thanks for all the replies.


#8

What I find interesting is, when I ran this test piston over and over again,
each time, the Memory size increases between 30-50 bytes.

I hit test about 15 times consecutively, and it went up every single time.

Currently showing:
temp

I realize that my variable changed a bit in length each time (since the random color names are all different lengths) but in 15 clicks, it went up nearly 600 bytes. (+0.6% memory used)

There is definitely something going on behind the scenes