At your request, I created a formula that essentially cuts a diagonal path across all possible numbers.
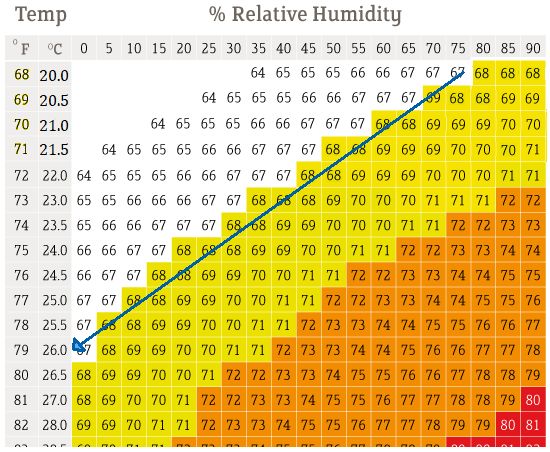
When the current data is to the upper left of the line, the fan turns ON.
When the data is to the lower right of the line, the fan turns OFF.
When the temp is less than 68, or greater than 79, the fan turns OFF
Here is a precise breakdown:
     Temp & Humidity
  FanOn      |    FanOff
¯¯¯¯¯¯¯¯¯¯¯¯¯|¯¯¯¯¯¯¯¯¯¯¯¯¯¯
             |  80° or higher
79° & 0%     |  79° &  1-100%
78° & 0- 7%  |  78° &  8-100%
77° & 0-14%  |  77° & 15-100%
76° & 0-21%  |  76° & 22-100%
75° & 0-28%  |  75° & 29-100%
74° & 0-35%  |  74° & 36-100%
73° & 0-42%  |  73° & 43-100%
72° & 0-49%  |  72° & 50-100%
71° & 0-56%  |  71° & 57-100%
70° & 0-63%  |  70° & 64-100%
69° & 0-70%  |  69° & 71-100%
68° & 0-77%  |  68° & 78-100%
             |  67° or lower
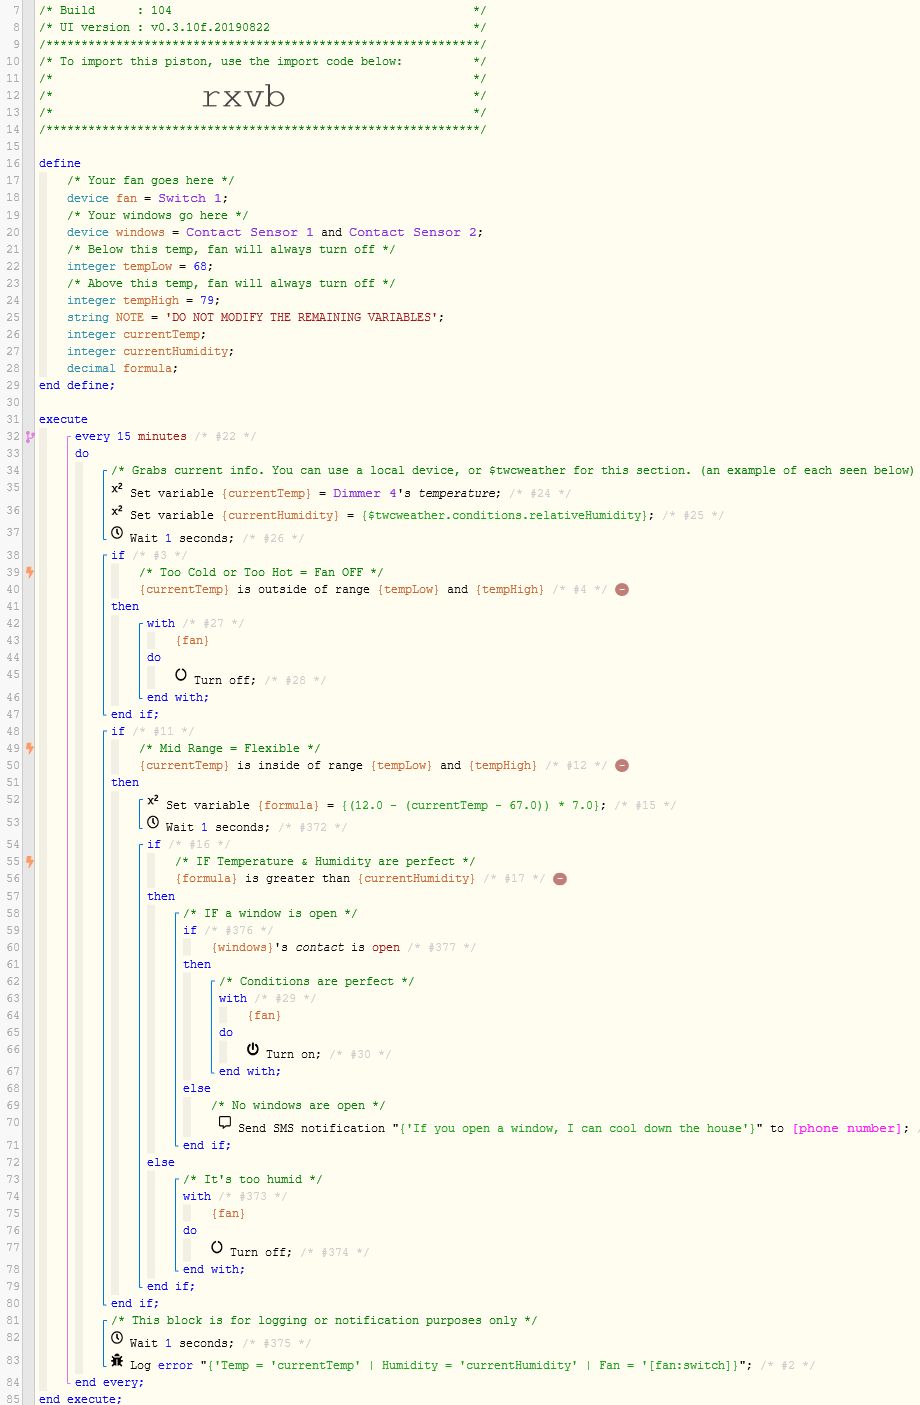
… and of course, the highly anticipated piston.
I added a bunch of comments to help you make sense of it all…
When importing this, make sure you pause any other pistons that are controlling the fan when testing this new piston. (It updates, and corrects the fan every 15 minutes)