Another "There was a problem loading the dashboard data" error

bug

#1

I have three locations with one hub each. I’m using webCore at all three locations.

Two of the hubs are at my home, the third at my holiday home. One of the hub’s at my home is only used for testing purposes and seldom used (I bought it when the Home hub went offline two months ago and after Samsung Support had initially decided that the hub was faulty. They fortunately later on got the hub back online again). The second hub is however still online all the time (for no reason actually). I only got to recreating about five pistons on it when the original hub came back online.) The second hub at my home (Home Hub) is, therefore, the hub in use. I would not have guessed, but I had a look in the IDE, and I have more than 80 pistons running on this hub. The problem I have, relates to this Hub.

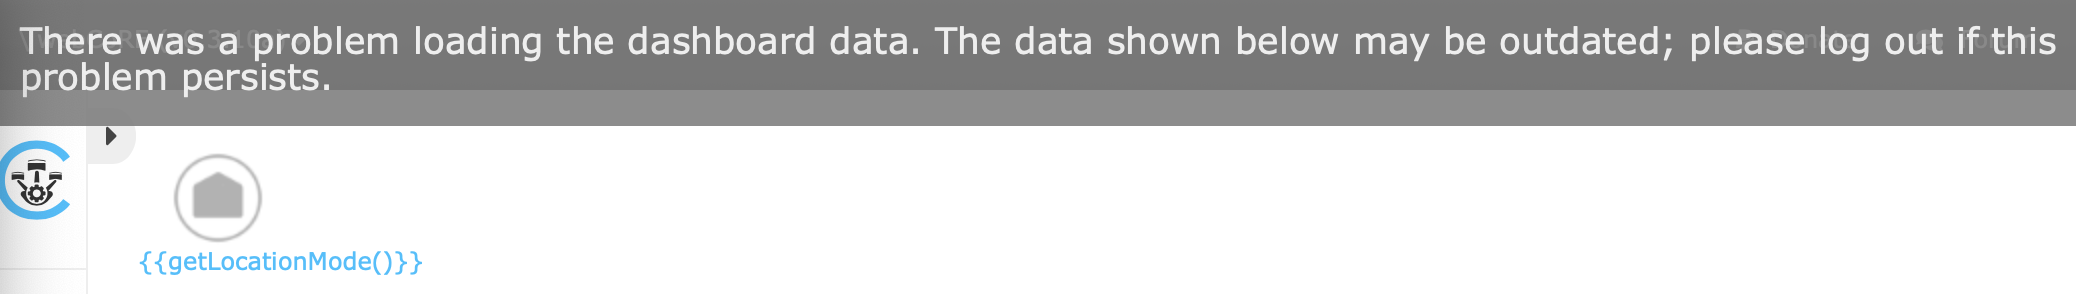
Since last night, I’m unable to access the Dashboard of the Home hub, getting the “There was a problem loading the dashboard data. The data shown may be outdated; please log out if the problem persists”.

The issue is limited to the Home Hub. On the other two hubs, the browser Dashboard and Smartphone apps are working perfectly.

I did the following, without success:

  • Logged out of the Dashboard, but afterwards, I’m unable to access the dashboard at all. The same error message about the outdated data appears, and after that, I end up in the holiday home’s Dashboard.
  • Tried Internet Explorer, Firefox and Chrome.
  • Tried Internet Browser in Incognito Mode
  • Tried to change the password from the Smartphone app.

I noticed the following which may be of significance:

  • The Smartphone app fails to list the Smartthings devices with a “Something’s Wrong” error.
  • Attempting to change the webCore Dashboard password, ends up with a blank page at the last step and when clicking on SAVE , the following error is displayed: “Error bad state. Unable to complete page configuration.” The password was however registered as I have to use the new password now when trying to register a browser.
  • Under “Maintenance” in the phone app, Memory usage is shown as 98%
  • Clean up and rebuild data cache displays a “Something’s Wrong” error after about 15 seconds
  • All pistons of the Home hub seem to be executing.
  • I wanted to make some changes to a six-month-old piston yesterday which failed to save, despite numerous attempts. It would go up to chunk 19 during the save process and then stop. I, fortunately, have a backup (to file) of the piston, so after noticing the errors below (physicalgraph.exception.StateCharacterLimitExceededException: State cannot be greater than 100000.0 characters), I suspected that this piston may be causing the Dashboard issues, so I deleted the piston from within the Samsung IDE (Locations > Select Home hub > List SmartApps and deleted the suspicious piston’s Smartapp). That did not resolve the issue either.
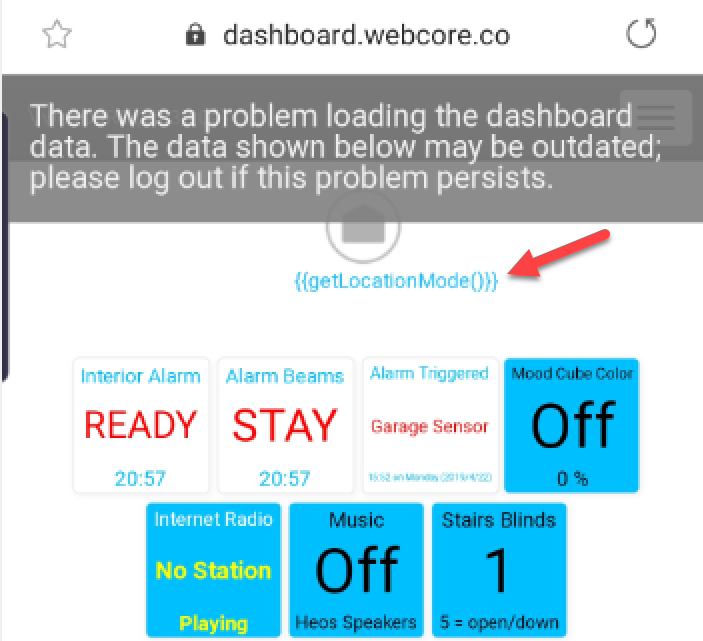
  • I tried to access the Dashboard from the Phone App, and noticed this:
  • When trying to do a backup of my pistons (from the Dashboard of one of the other hubs, I get the following error:

I don’t notice any obvious issues in the Samsung IDE listing of apps or pistons, but the following errors in the IDE log are probably relevant:

7817b498-e827-40d9-ad6a-ef776e59fa3b ‎07‎:‎52‎:‎56: error java.util.concurrent.TimeoutException: Execution time exceeded 20 app execution seconds: 308073189580465 @line 2223 (md5)
7817b498-e827-40d9-ad6a-ef776e59fa3b ‎07‎:‎52‎:‎56: debug getChildDevices(false), children=0
b5dfe921-6393-4105-b723-382172bd838a ‎07‎:‎52‎:‎56: debug Generated list of devices in 18410ms. Data size is 189733
7817b498-e827-40d9-ad6a-ef776e59fa3b ‎07‎:‎52‎:‎36: error Dashboard: Authentication failed due to an invalid token

and

40d9-ad6a-ef776e59fa3b ‎07‎:‎56‎:‎16: error physicalgraph.exception.StateCharacterLimitExceededException: State cannot be greater than 100000.0 characters
79df3be5-147e-4b14-98ef-e5269beeee98 ‎07‎:‎56‎:‎12: info smartapp_pause called by smartAppName=webCoRE Piston, value=994, smartAppVersionId=f2abbdf1-ba5c-45b2-9542-d52a6c8724d5
46a0fc4e-3678-4f45-a642-e26c41dc1bd2 ‎07‎:‎56‎:‎07: info Polling. Time since last contact is 8.7063333333 minutes
e3e2e079-69ba-441e-9296-df4d690cc48f ‎07‎:‎56‎:‎03: debug [name:rssi, value:-55, displayed:false, isStateChange:true, linkText:ST-D1-01, descriptionText:ST-D1-01 rssi is -55]
e3e2e079-69ba-441e-9296-df4d690cc48f ‎07‎:‎56‎:‎03: debug Parsing: rssi -55

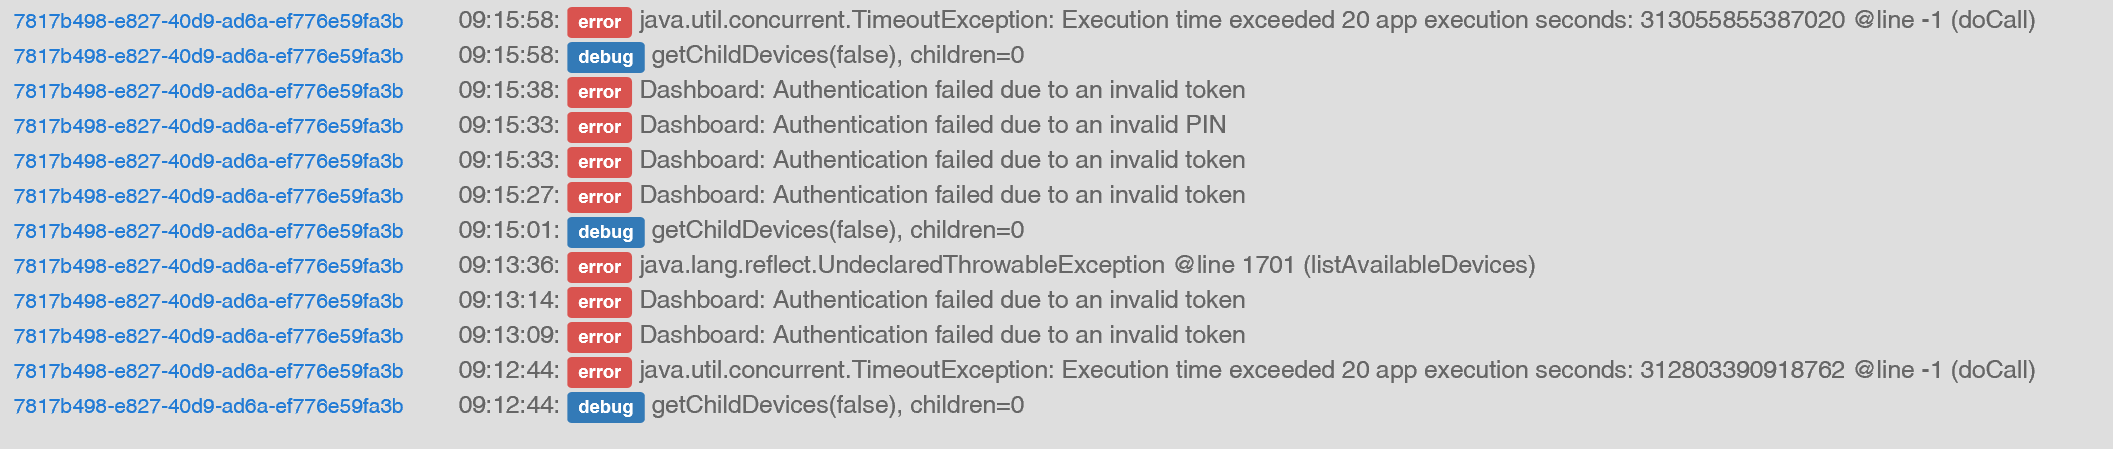
The IDE log for two attempts to add the Dashboard to a browser (I entered the Dashboard browser PIN incorrectly once):

Any assistance would be greatly appreciated.


#2

After you deleted the piston, did you go into settings again in that instance of webcore and run rebuild and clean up data cache? In your post, I see you only ran it before you deleted that piston.


#3

Yes, I’ve tried it again a few times.


#4

I believe I accidentally stumbled upon the cause of the problem.
My Holiday Hub got renamed to “Home”, which is the same name as my home hub. After changing the name of the holiday-home hub back to the original name, I tried registering the Dashboard again and it worked!
I doubt that the issue is the two hubs having the same name, but I suspect that the name changes must have reset the location or something and at the same time the webCore database in some or other way?
I am fairly sure I know what changed the name of the holiday-home’s hub : I started using a new mobile phone (Samsung S10) yesterday and the new Smartthings App was installed during the phone setup. I accidentally opened the app tonight and noticed that the app showed two hubs with the same name. Now this had happened some months ago as well and I subsequently uninstalled the new Smartthings app from my previous mobile. I don’t know why the new app is causing the hub name to change, but it seems that the name change (and changing it back) got webCore going again. I have obviously now uninstalled the new app.


#5

I’m getting this same error. I only have one hub.


#6

Any changes to your locations?


#7

None that I’m aware of.


#8

@ipaterson will probably ask you to provide any generated logs from IDE when you try to load the page :slight_smile:


#9

3:45:20 PM: error java.lang.reflect.UndeclaredThrowableException @line 1701 (listAvailableDevices)


#10

Last time I couldn’t load the dashboard (not sure if it was the same error) it resolved itself next time I added a new device. I can’t try that right now.

For now I’m dead in the water with webCoRE.


#11

Signing out and registering a new browser does not resolve it, nor does adding a new device this time.


#12

What happens if you create a new instance and try to login to it?


#13

Dashboard loads fine on a new instance.

When trying from a new registration I am getting this in Live Logging:

error Dashboard: Authentication failed due to an invalid token

then the

error java.lang.reflect.UndeclaredThrowableException @line 1701 (listAvailableDevices)

Noted in my earlier post.


#14

I’m getting the same 9:58:06 AM: error java.lang.reflect.UndeclaredThrowableException @line 1701 (listAvailableDevices) error. Webcore just stopped loading for me about 3 days ago. Figured there was just an issue with it, but I can’t log into the dashboard, or if I do, the moment I click on a piston it takes me back to the authentication page. Well, at least it was doing that yesterday, today after I’ve logged in the dashboard is just straight blank, even though I have pistons that I know are still running.

I’ve tried going into settings and Clean up and rebuild data cache, but I get a Something’s Wrong We can’t load your screen right now error. I’ve tried logging into in Chrome, Edge, in Incognito mode, registering a new browser, launching the dashboard from the app, changing the password in the app.


#16

For my IDE? graph-na02-useast1.api.smartthings.com


#17

I wonder if it is related to the issue with installing webcore on NA02


#18

Maybe, I’m still using the classic app as I haven’t been migrated.


#19

My problem is back. Once again getting the error. I noticed this for a moment on my Dashboard:

image

This time, the error started to appear after editing the same piston which previously caused an error. The piston would not safe, only getting to chunk 17 of 19. After it failed to save, the Dashboard started to show the error again.

Could there be a bug in webCore which corrupts the piston database (is there such a thing?) if a large piston fails to save?

I wanted to investigate why the particular piston does not give the result it should. The top part of the piston seems to execute fine, but the bottom part fails to.

Memory usage is back to 97% according to the phone app and so are the other symptoms I’ve described in my initial post.

Hope someone will be able to assist those of us experiencing the issue.


#20

Are you on the na02 shard? If yes, I recommend that users experiencing this issue report it to SmartThings support per my post above. Put a subject line starting with “ webcore-issue-ap02 ”. In the email, please include the username and approximate time the error occurred, if you can.


#21

Reported to ST Support. I should get a response in about a week telling me to reinstall all my devices ;).

Ticket: #736708