API with avg/record high & low for today at my location?

temperature
weather

#1

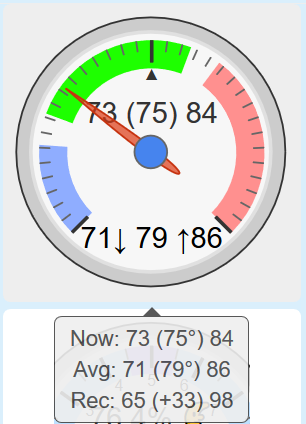
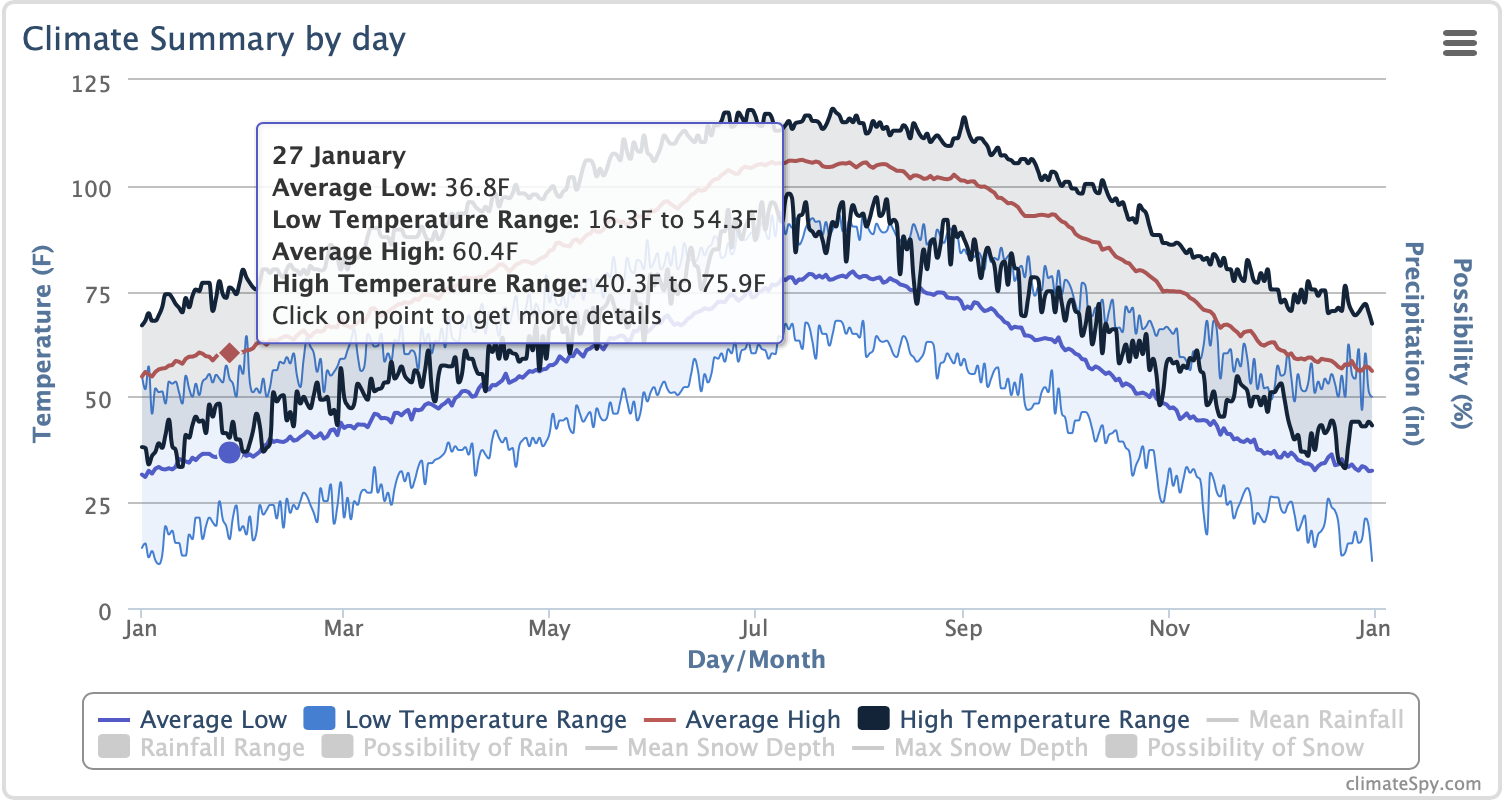
I have a really cool idea in my head, but I first need access to four dataPoints:

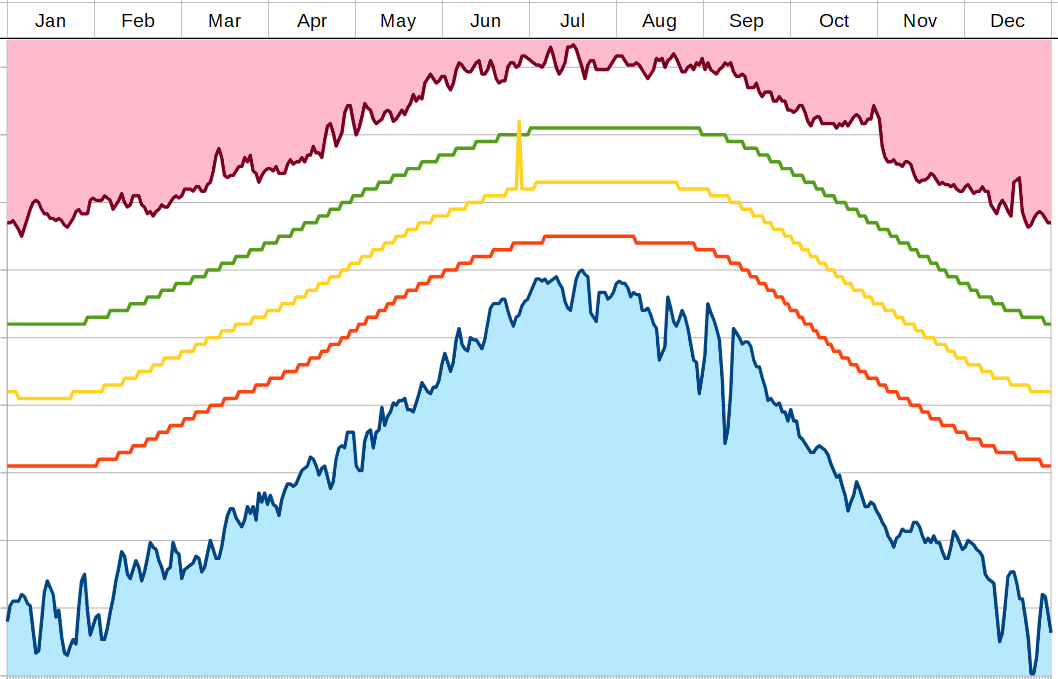
  • the average high & low for today’s date
  • the historical (record) high & low, for today’s date

Does anyone know a free/public API that has this data available for my (US) location?


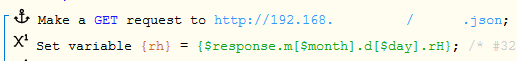
In the past, I might have used:

  • $weather.almanac.almanac.temp_high.normal.F
  • $weather.almanac.almanac.temp_high.record.F
  • $weather.almanac.almanac.temp_low.normal.F
  • $weather.almanac.almanac.temp_low.record.F

but WUnderground pulled the plug on us…


Temperature Records API using Google sheets
Gauge for Length of Day (showing Solstices & Equinoxes)
#2

ask:)))) :joy::joy::joy::rofl::rofl::joy::joy::joy:


#3

*shakes the ball again*

How about now? LOL


#4

Anyone…??


#5

The best I could find is the NWS report:
https://w2.weather.gov/climate/index.php?wfo=rah

Daily climate report looks like this:

...THE RALEIGH-DURHAM INTL AIRPORT NC CLIMATE SUMMARY FOR DECEMBER 15 2019...

CLIMATE NORMAL PERIOD 1981 TO 2010
CLIMATE RECORD PERIOD 1887 TO 2019


WEATHER ITEM   OBSERVED TIME   RECORD YEAR NORMAL DEPARTURE LAST
                VALUE   (LST)  VALUE       VALUE  FROM      YEAR
                                                  NORMAL
..................................................................
TEMPERATURE (F)
 YESTERDAY
  MAXIMUM         61    302 PM  75    1971  53      8       49
  MINIMUM         35    735 AM   8    1958  33      2       42
  AVERAGE         48                        43      5       46

PRECIPITATION (IN)
  YESTERDAY        0.00          1.75 1901   0.10  -0.10     0.23
  MONTH TO DATE    2.53                      1.49   1.04     3.73
  SINCE DEC 1      2.53                      1.49   1.04     3.73
  SINCE JAN 1     42.18                     41.76   0.42    57.79

Now that you know the name of the NWS product, it’s easily to Google. Discussion here:

Ontology to get the links for your location of interest, such as HRAH for Raleigh-Durham:
https://api.weather.gov/products/types/cli

And the output from the API for Raleigh-Durham:
https://api.weather.gov/products/52c24568-50e2-4602-b6fb-bc5062cd29b5

That ain’t very pretty JSON, though. Downright nasty to parse it, but I think it’s at least fixed width. Good luck!


#6

Thanks @milhouse for the information… That data would work perfectly… but unfortunately, the nearest NWS station to me is 55 miles away, with very different weather patterns…


#7

Well, I’d suggest you pick up and move 55 miles, but that’s probably unlikely. :smiley:


#8

Man, this stinks… I have such an awesome idea in the works, but my creative juices are in limbo until I can find access to free historical weather data…


#9

Based on my search, it looks like TWC has (or had) an almanac section in their api but we are not getting it in WebCoRE. (https://twcservice.mybluemix.net/rest-api/)

They have tools to test it but I couldn’t get it to work. Not sure if it is still supported or not.


#10

I will take a look tomorrow. Thanks for the link!


#11

Uggg… I have tried dozens of variations, but no luck with that mybluemix link.

I get blanks, nulls or “error”: “no response from server”


Thanks for the info though… I am not giving up on this idea…


#12

I am seriously considering creating my own API for historical weather data in my location…
Although, if I go this route, then unfortunately I will not be able to publicly share my piston.


#13

Well, I finally took the time to create my own API listing my city’s record/average Highs and Lows.

gaugeC

I think I broke my record on this one… It is displaying at least 12 dataPoints in a single gauge…
(not counting the hover text)

Essentially, this compares the current temp to the daily high/low… and that is compared to the average high/low… and all of that is kept within the bounds of the record high/low.


Note:

If I ever find a free API that lists historical data, I will share this baby in a new thread.
(there are many elements to it that I do not want to reveal yet)


#14

Interesting… Each dayLength is shorter than the last, and yet, we have not even begun the hottest two months of the year.

This image shows data for the entire year:

pic

(The yellow spike is a single fake data point pointing to today)


#15

The annual variation is much like the daily variation. The hottest part of the day is never at noon but a little before sunset and the coolest part of the night is a little before sunrise. This long days build up heat in the ground which keeps warming the days up long after the days begin to shorten. It is quite an interesting phenomenon.

I am curious how you did this. Did you download all the records for the year and store them somewhere?

You have created another gauge for me to envy. I used to have only the day length gauges for like 6 months and now I have like 6 or 7. I am really enjoying this!


#16

I like the accuracy of WUnderground, so I did it manually.
(one year = 1,830 dataPoints, stored on my RPi)

Step one took about 3 (tedious) hours (30s per day), but this way, I am not reliant on a monthly fee, or held at the whim of some other company who decides to change their API policy.
(I mean, how often do we have a day that breaks the old record?)

I am actually OK with these dataPoints being static for the most part. If we have a record breaking day, I can just update that single dataPoint for future reference.

Of course, if I find a free API (with historical data), it will be easy to insert in this.

… and trust me… you guys will want to see this final product!
(I may have surpassed myself)


#17

For some reason, I found this phenomenon interesting as well…

pic%20-%20Copy

It reminds me how the outer track on a raceway is a longer path than the inner one…

(although the imaginary blue lines are not quite as prominent in the Winter)


#18

Note to self:

I think I prefer the record high & low to be stored in a 5 day average (blunt) instead of my earlier 3 day average (sharp).


#19

I found one site (climatespy.com) that seems to have all the data for my area with a nice interactive graph but no access to the data in table form so too difficult to extract :frowning:

I was thinking if I need to create my own API for this (whatever you are creating), I can use the google sheets interface to look up data by date. I just need to get all the data into a spreadsheet
first.


#20

I admit, I made more work for myself than necessary. I wanted to be able to visualize the data, so I typed it all into a spreadsheet first… But the real magic happens in my text.json file, which is stored on my RPi.

This lets me grab that data using minimal coding afterwards; for example here is today’s recordHigh:

pic


Note:

There are online converters to go from spreadsheet to json, but none of them retained the structure that I needed, so I broke conventions by hand writing my local file.

Warning: This is a very boring task, so finding a free API would definitely be the preferred method.