Gauge for Length of Day (showing Solstices & Equinoxes)


#1

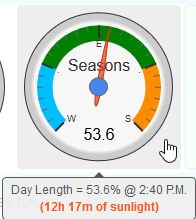
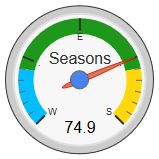
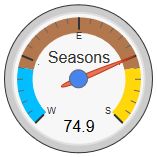
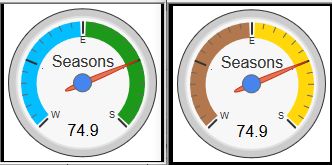
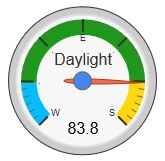
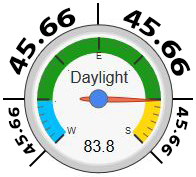
I made a piston a few months ago, and I think it is time I shared it with others. This one draws a gauge on my dashboard that monitors the amount of sunlight on any particular day. Basically, far left on the dial is the Winter Solstice (the shortest day of the year) and the far right is the Summer Solstice (the longest day of the year). When the dial is straight up (50) it is one of the 2 Equinoxes (days and nights are equal).

wc_Equinox2

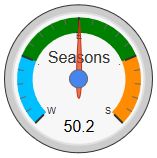
(This picture was saved a few hours after our last Equinox)

There is a bit of math required to get this one customized to your location, but if you are interested, keep on reading. (The first few steps are done with a calculator, pen and paper)

First, you need to find the longest and shortest days for your location (down to the seconds for accuracy). I put in my city at www.timeanddate.com/sun/ and then examined the “Daylength” in late June and then in late December to find the extremes. Take note of the longest time in June, and the shortest time in December.
(For me, it was 14h 01m 57s and 10h 22m 24s) <<-- This last time will be used in webCoRE

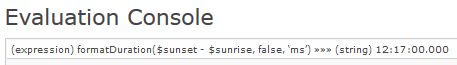
Next, we need to convert those times to something understood by webCoRE.
Use the Evaluation Console as an expression something like this:
datetime('14:01:57')
-and-
datetime('10:22:24')
Use your numbers instead of mine, and make note of both responses.
(for me, it was 1529607660000 & 1529594520000)

Next, subtract the small number from the larger number.
(For me, it was: 1529607660000 - 1529594520000 = 13140000) <<-- This number is used in the next step
This answer tells me that in my city, there is 13,140 seconds (3.65 hours) difference between the amount of daylight between the two Solstices.

Next, we want a conversion rate of 100, where 0 would be the shortest day, and 100 would be the longest day. So (getting as many decimal places as we can) we do this formula:
100 / 13140000 = 0.000007610350076103501 <<-- This last number will be used in webCoRE
(make sure you replace my 13140000 with your number)

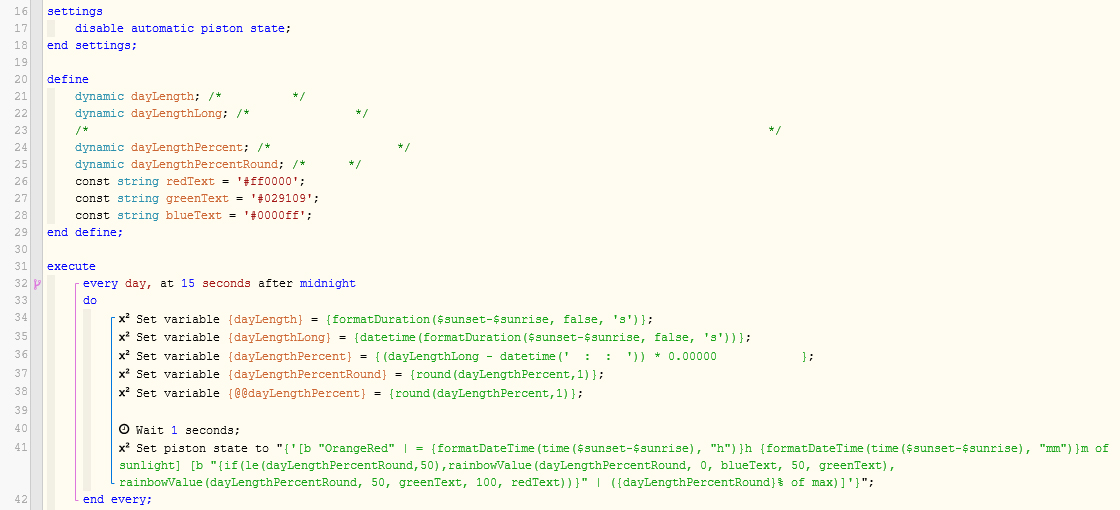
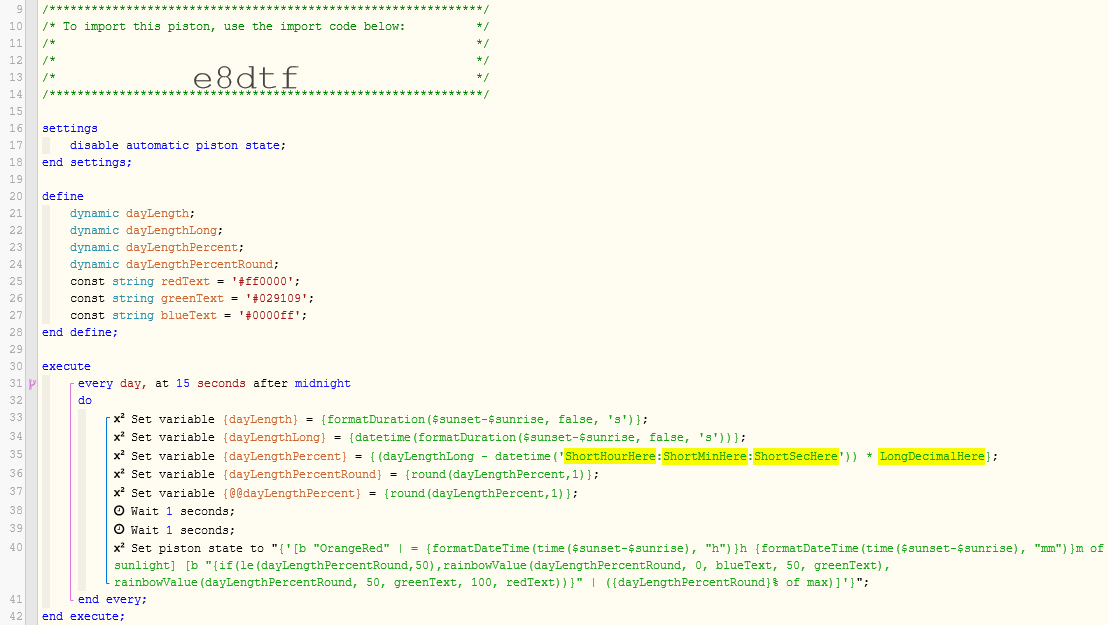
Then in webCoRE, we make a piston:

define
integer dayLengthLong
decimal dayLengthPercent
end define

Every day, at 15 seconds after midnight
do
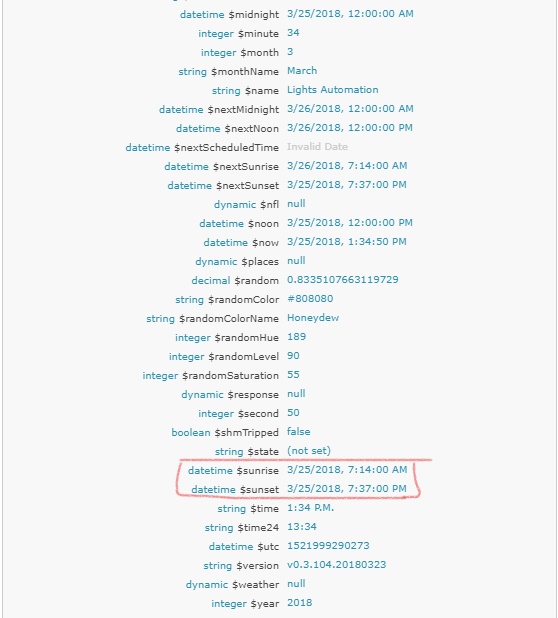
Set variable {dayLengthLong} = {datetime(formatDuration($sunset-$sunrise, false, 's'))}
Set variable {dayLengthPercent} = {(dayLengthLong - datetime('10:22:24')) * 0.000007610350076103501}
Set variable {@@dayLengthPercent} = {round(dayLengthPercent,1)}

Notice this last variable is a GLOBAL variable so it can be referred to by other pistons. Also make sure you substitute your December shortest time where I have 10:22:24 above, and your ultra small number in place of my 0.000007610350076103501

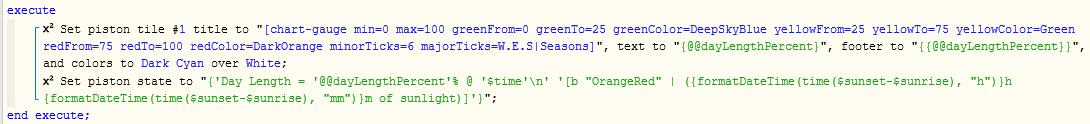
Alright, the preparation math is done. Now we are moving on to drawing the gauge.

Set piston tile #1 title to "[chart-gauge min=0 max=100 greenFrom=0 greenTo=25 greenColor=DeepSkyBlue yellowFrom=25 yellowTo=75 yellowColor=Green redFrom=75 redTo=100 redColor=DarkOrange minorTicks=6 majorTicks=W.E.S|Seasons]" text to "{@@dayLengthPercent}", footer to "{{@@dayLengthPercent}}", and colors to whatever.

Set piston state to "{"Day Length = "@@dayLengthPercent"% @ "$time}";

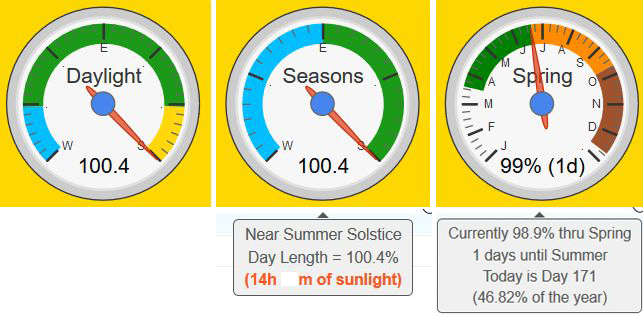
And there you have it! A great ‘bird’s eye view’ of where we are in the yearly cycle.


Edit:

For those who are a bit overwhelmed by this manual approach, I have a piston below that can be imported. (although you will miss some good posts if you jump right to post #52)


Lights on to simulate a 14 hour day
Why no notifications on Wind speed for my blinds?
#2

Here’s a variation on the Set piston state:

‘[b “OrangeRed” | = {formatDateTime(time($sunset-$sunrise), “h”)}h {formatDateTime(time($sunset-$sunrise), “mm”)}m of sunlight]’

Which yields something like this:
temp

But I think we loose a couple of minutes of accuracy if this variation runs after sunrise.
(Best ran some time between 12:01am and 5am)


#3

That looks like a fun piston. Could you post the whole piston so I can copy it? Also, maybe you did it already, but after it is going, you could have the piston do the calcs so you would not need to do them again for next year.


#4

Maybe you can try using formatDuration(), it’s can provide precision up to ms


#5

I actually have the entire piston shown above. Although I did split it up into two pistons. One runs shortly after midnight to find the length of that day. (this is the heavy math section at the top) And one piston simply draws the gauge. (shown at the bottom of my first post) Unfortunately, this is not one of those pistons you can simply import to have it be accurate for you. You actually have to do the math (only once), and then the piston will work for years without editing it again. (the day of the solstice changes slightly each year, but the longest day and shortest day are practically the same duration. (I saw a 1-2 second variance in ten years)

But, at your request, here is my piston in it’s entirety. I removed the numbers for my location, so you still have to do the math, but maybe the image will help visually. (although I recommend following my steps in my first post for the actual math)

Here is my piston to get the current day length, and convert it into a scale from 0 to 100:

And here’s my simple piston to draw the gauge
(although nobody is stopping you from combining these two pistons into one):

If you need help with the math section for your city, I would be glad to help. I just don’t want to publish code that is only accurate for one person (me).


#6

I do use that formula in my code, but webCoRE and www.timeanddate.com both round to the nearest second.


#7

for the precision, you can use ‘ms’, for example, formatDuration($sunset - $sunrise, false, ‘ms’)


#8

Interesting. Every time I tested that in the console, it was always in whole seconds. No milliseconds when querying webCoRE.

temp


#9

well I guess webcore itself doesn’t have the precise ms precision when it comes to $sunrise and $sunset, you can see from the variables list that it’s rounded to minutes even… Not sure if it’s true? @ady624


#10

Good point pauly. I just did a test with mine, as long as the preliminary math is precise (mine is 21 decimals long), the final answer should be within 0.43% of accuracy.

So, for example, assuming the worst, where:
10:20:29:999 rounds down to 10:20
and 2 milliseconds later
10:20:30:001 rounds up to 10:21

The final output will always be within 0.43% of accuracy. For a birds eye view of the entire year, I think this is an acceptable margin of error. (Although my gauge will become even more accurate if webCoRE starts giving us more precise sunrise & sunset times.)


#11

Sorry to be a pain, but if you save the using the green camera, then paste that image here, then I can use the import code to import your piston directly. That will save me from typing it all in and getting it wrong because of a typo.


#12

Yeah just did a research at the webcore weather wiki, hoping that weather API could bring a more precise sunrise and sunset time but turned out that API don’t even have sunrise and sunset time, I guess minute is the most precise time we can get


#14

Here is the green camera that you asked for. The highlighted sections are supposed to be numbers, but I do not want to publish code that is only accurate for one person (me), so the math still has to be done for your location. But at least this way, there should be no typos. :grinning:

Let me know if you need help with the math for that section.

Also, please ignore the double Wait command. This should not be in there.


#15

And for reference, here is my gauge (and hover text) about 5 days after the equinox

temp


#16

Perfect, thanks.


#17

I have tweaked my code a tiny bit after noticing an interesting pattern.

I noticed recently that the day length changes swiftly near the Equinoxes (middle),
and slows down quite a bit near the Solstices (outer extremes).
Picture a sine wave… It lingers at the top and bottom much more than in the middle
Sinewave_horizontalview
The tick marks have not changed, and are based entirely on the amount of daylight…
(Shortest day = 0, and longest day = 100)

But I have adjusted the colors a bit so the colors represent one fourth of a year.
(about 91 days each)

You can see from the pic below that today is nearly 75%, which means that my day length is halfway between what it is on the Equinox vs the Summer Solstice… but there is still about 13 more days until we are 46 days (1.5 months) past the Equinox, and the dial moves into the yellow zone.

temp

This deviation is because the length of day changes swiftly when we are near the Equinoxes (middle of the dial) and the daily change is much less noticeable near the Solstices (ends of the dial)

So even though it’s hard to imagine, in one full year, the dial spends an equal number of days in each color. Half the year moving slowly to the right (with green signifying Spring), and half the year moving left (the green changes to brown then for Fall).

temp
I faked the data for this last pic to show the brown in Fall…
Normally, the brown is only seen after the Summer Solstice
when the dial starts to move back to the left.

EDIT - I am still not happy with the shade of brown above, so I will eventually find a more suitable color to represent Fall.


Analog vs Digital - Astronomical Observations
#18

It just dawned on me that I should probably not have used the word ‘Fall’ or ‘Spring’ above, since technically, the colors do not align with the seasons shown on your calendar. Instead, I have made the colors above centered around the shortest and longest day of the year. This makes more sense to me since this gauge is tracking the Sun’s light. My original 3 color split above seems to convey the trend of the yearly cycle quite nicely.


Be that as it may, for the traditionalists out there… here is a single line of code you could change to make the gauge more accurate based on calendars, and less accurate based on sunlight/heat vs darkness/cold.

temp

The code for Winter/Spring is:
[chart-gauge min=0 max=100 greenFrom=1 greenTo=49 greenColor={colorWinter} yellowFrom=51 yellowTo=99 yellowColor={colorSpring} minorTicks=6 majorTicks=W.E.S|Seasons]

and for Summer/Fall is:
[chart-gauge min=0 max=100 greenFrom=1 greenTo=49 greenColor={colorSummer} yellowFrom=51 yellowTo=99 yellowColor={colorFall} minorTicks=6 majorTicks=W.E.S|Seasons]

The {colorX} seen above are just variables, so you could pick any colors you like


#19

I just wanted to give you all an update. Mother nature has taught me another lesson.
(and my colors had to be adjusted a bit more)

About 45.7 days ago, we had the March Equinox (straight up on my gauge = 50), and about 45.7 days in the future we’ll have the June Solstice (far right on my gauge = 100). But as you can see from this picture, the dial is not close to (75) the center of those two. (I explain why above)

GaugeDaylight_5-05

My gauge spans 6 months when moving towards the right, and another six months when moving towards the left. So while the tick marks are quite accurate on the length of day throughout the year, I calibrated the colors to show equal time periods throughout the year. (In a full year, the dial will spend about 91.3 days inside of each color) The following picture breaks the six months up into 4 equal parts of approx 45.7 days each, so you can see the contrast.

GaugeDaylight_5-05_Tidy

I find it quite interesting to see just how swiftly the day lengths changes near the Equinoxes, and just how slowly it changes near the Solstices. For my location, each minor tick mark represents about a 6.5 minute change. Near the Equinoxes, it takes about 4.5 days to move one tick, but near the Solstices, it can take a whopping 17 days to shift the same amount.

Of course, the beauty of this dial is it displays both:

  • The amount of daylight (as seen in the number and the tick marks)
  • The amount of time spent in each 3 month quadrant (as seen in the colors)

For anyone wanting to tweak your version of the gauge, the only code I changed was the display:

[chart-gauge min=0 max=100 greenFrom=0 greenTo=16 greenColor={colorWinterEnd} yellowFrom=16 yellowTo=84 yellowColor={colorSpring} redFrom=84 redTo=100 redColor={colorSummerBegin} minorTicks=6 majorTicks=W..E..S|Daylight]


And for those of you who like numbers:

When comparing the 91.3 days centered around each event, this translates to about:

  • 16%:arrow_lower_right: & 16%:arrow_upper_right: daylight changes around the December Solstice (16-0-16%)
  • 68%:arrow_upper_right: daylight changes around the March Equinox (16-84%)
  • 16%:arrow_upper_right: & 16%:arrow_lower_right: daylight changes around the June Solstice (84-100-84%)
  • 68%:arrow_lower_right: daylight changes around the September Equinox (84-16%)

For those curious as to the reasons why this happens, check post #17 above.

(Hint: It’s the same reason the crash location of China’s Tiangong-1 space lab was predicted to be near the extreme north or south of it’s orbital path. Look how much time it spent at the extremes, and how little time it spent near the equator)


#20

Well, it’s about time for an update on my ‘yearly’ gauges…

We are 24 hours away from the Summer Solstice, and here are my gauges with hover-text.
(I still haven’t decided which one I am going to keep, since all 3 show different perspectives)

gauges

(The yellow background shows up a day before the Summer Solstice as a visual cue for me)

The first two are entirely based on the length of day… The 3rd gauge is based on the day of the year, so it is not as precise as the other two…

All three gauges divide the year up into 4 equal sections, but they each do it a bit differently…

The LEFT gauge shows the quadrants centered 91 days around the solstices & equinoxes

The MIDDLE gauge splits the year up evenly into 4 colors (official seasons)

The RIGHT gauge is a seasonal overview, but it may be up to 24 hours off since it is based on the dayOfYear

NOTE:
For the really observant, you may have noticed the dayLength is showing at 100.4%. This is because webCoRE rounds the sunrise and sunset to the nearest minute. This means at anytime, the accuracy can be off as much as 0.4% for my location. (If webCoRE starts returning more accurate data, my gauge will auto-correct)


Share your Dashboard
#22

Hi Alwas, thanks for the questions.

First off, my current piston states can be seen in the ‘hover text’ as shown 2 posts back… but they can be modified to fit you, of course…

It is important to note that the first two gauges are extremely accurate (within 30 seconds since webCoRE rounds dayLength to the nearest minute). On the other hand the 3rd gauge (the one you mention) is entirely based on the day of the year. (and solstices and equinoxes can vary a day or two each year) This means the 3rd gauge is the one easiest to share with others, but it also means it is the least accurate. (it could be 24 hours off in either direction)

If you want the data without the gauge, then I suggest creating a piston from the data found in the very first post here. It is a lot of math required, but it only needs to be done once, and it remains accurate for years and years.

Let me know your thoughts, and we can go from there