Gauge tiles not showing correctly


#16

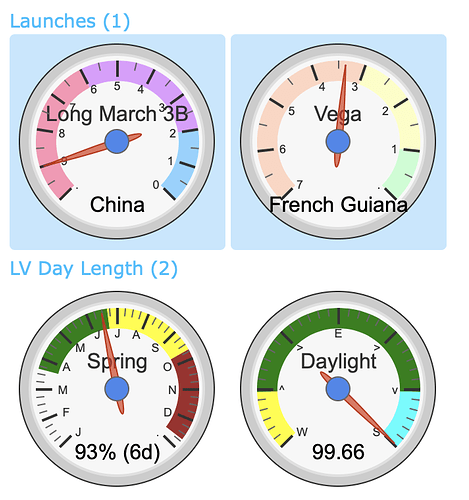
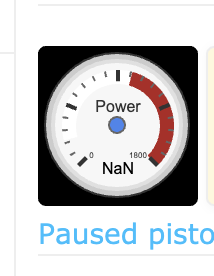
Ugg… Two days later, and all 20 of my Google’s gauges are still blank…

pic

(tested on Chrome, as well as three different Mozilla browsers)

For those who can still see gauges, I am very curious as to what is different between my setup and yours? (could it be shard related? or what country we are in?)


#17

No Gauges on EU/UK Shard.

Tried on Chrome, Edge, FireFox and a few others.

No biggie for me… I rarely visit the dashboard unless I’m tweaking something.


#18

Thanks for the update, @Robin

I don’t even know where to report this… Hopefully someone else already did, and Google fixes it on Monday when they come back to work.


#19

Is there anyone at this point who has working gauges?

Mine are still out. US (Eastern)


#20

Mine are still out as well, US Eastern as well.


#21

The only person who has mentioned working gauges recently is @guxdude over here

Not sure if they are still working for him though…


#22

Mine are still working. I had a brief problem when I tried to display them on a second tab and they didn’t seem to work but once I closed the second tab, it worked again.


#23

Still not working here, apparently the google script was blocked?

From google chrome console…
Refused to load the script 'https://www.gstatic.com/charts/loader.js' because it violates the following Content Security Policy directive: "script-src 'self' 'unsafe-inline' 'unsafe-eval' www.google-analytics.com www.google.com *.api.smartthings.com *.hubitat.com *.googlesyndication.com googleads.g.doubleclick.net csi.gstatic.com maps.google.com maps.googleapis.com *.fontawesome.com". Note that 'script-src-elem' was not explicitly set, so 'script-src' is used as a fallback.

Edit: I temporarily disabled CSP for the dashboard site and all gauges are back.


#24

Just did the same and they are all back now!

My standard square tiles though are still seemingly out of sync with old data showing even after all of the attempts and refreshes as listed above.


#25

Brilliant… I was just about frustrated enough to start my own digging… Thanks for getting me started…


I installed a CSP sniffer on my browser, and refreshed my Dashboard to study the data pulled…

It appears that the CSP is allowing:
csi.gstatic.com
but Google is now serving those from:
www.gstatic.com

Changing the ‘csi’ to ‘www’ (or * if you are adventurous) will allow the gauges to be drawn.


If it helps, here is my pic which successfully allows the Google gauges.

default-src 'none'; connect-src 'self' *.fontawesome.com googlesyndication.com; frame-src googleads.g.doubleclick.net; img-src 'self' data: google-analytics.com community.webcore.co; script-src 'self' 'unsafe-inline' *.fontawesome.com adservice.google.com *.api.smartthings.com maps.google.com maps.googleapis.com www.gstatic.com https://www.google.com/jsapi https://www.googletagservices.com/activeview/js/current/osd.js; style-src 'self' 'unsafe-inline' www.gstatic.com

Note: I had to place www.gstatic.com in both script-src and style-src for it to work…
(also there’s two references to fontawesome, so the Dashboard images would load fully)


I am pretty sure that these settings are configured on webCoRE’s side, so hopefully it’s easy to update.

Tagging @ipaterson


#26

I don’t have any gauges to test this out, is it fixed now?


#27

Negative, still have to do the CSP hack for them to show. Did a hard refresh as well to verify


#28

Unfortunately, no. When I refresh my page (using no plugins), the gauges are solid color. (not working)

Was there something in my example above that was not listed in webCoRE’s custom config?

(when I was condensing the fairly long list, I noticed the gauges stopped drawing when a few other Google links were left out)

It’s tricky though, because that first command:
default-src 'none'
means that anything not specifically listed, will not function


For testing or fun, here is a great piston that draws a gauge every 10 minutes…
(for others who find this later, just save it to a category that displays Tiles)


#29

I pasted in an example and this is what shows up for me:
50%20PM

As far as I understand the problem this image wasn’t showing up before? Are we all on dashboard.webcore.co?


#30

That’s more than I see…

pic

(all 20 gauges spread across 3 instances… It only draws the background color)

My dashboard is that same link, but it is https


#31

I think we’re good here. The page is cached by CloudFlare so I still occasionally get the CSP blocks but occasionally get the gauges on refresh. This should clear up over the next few hours while CloudFlare ages out. If still a problem tomorrow let me know and I’ll see if I can manually invalidate CloudFlare.


#32

Perfect… If anything, I have mastered the art of patience, LOL

Thanks for your help!!


#33

I can report that my home machine has now started showing all the gauges again so appears that it has been fixed! Thanks again!


#34

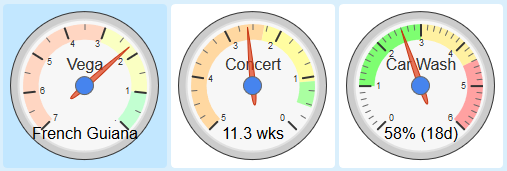
Looking good on my side too…

pic

Thanks again!


#35

While we’re somewhat on the topic :slight_smile: tell me more about your last 2x gauges there. The first one is what I do for a living and the second one I usually do on the weekends!