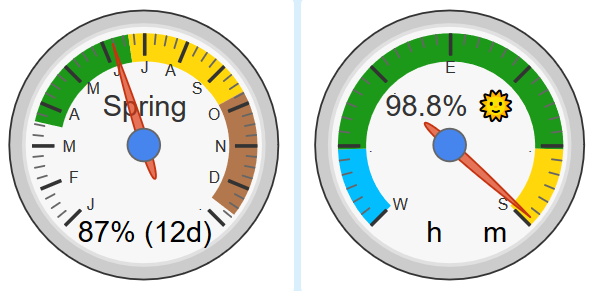
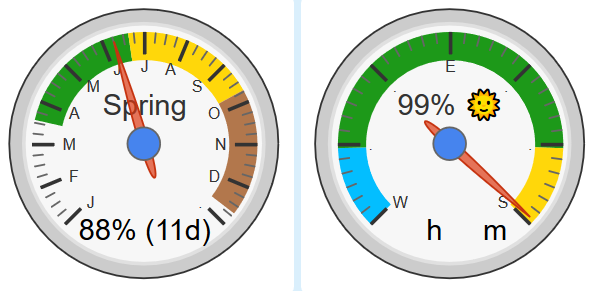
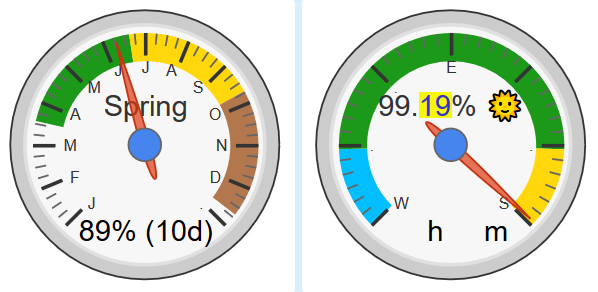
Sorry about this unintended side-effect, LOL
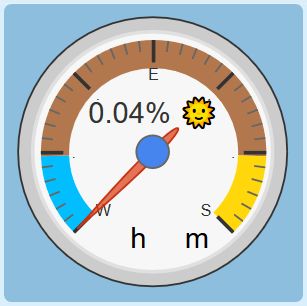
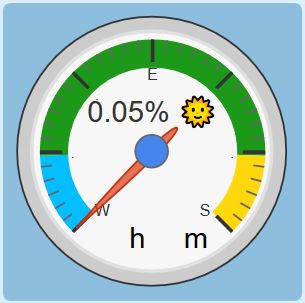
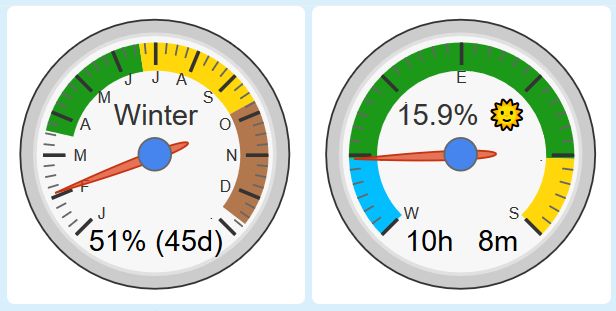
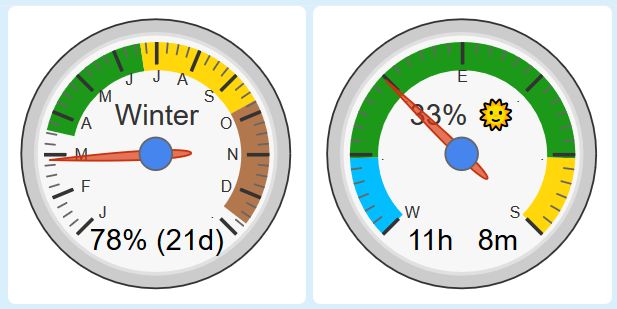
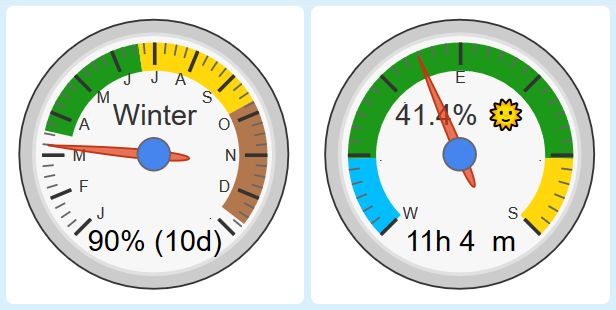
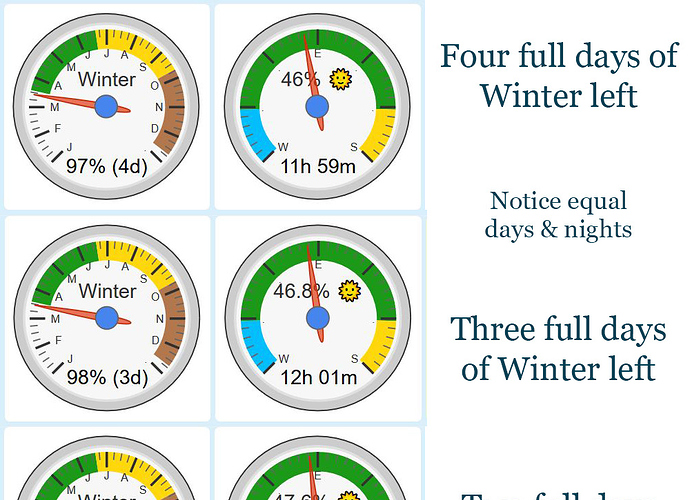
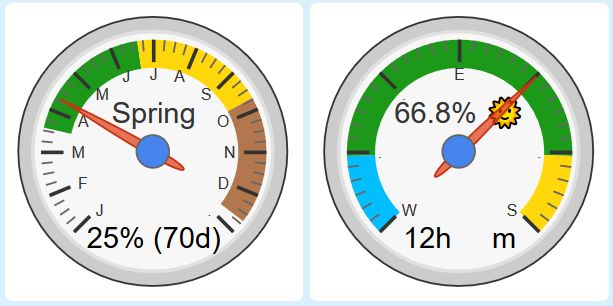
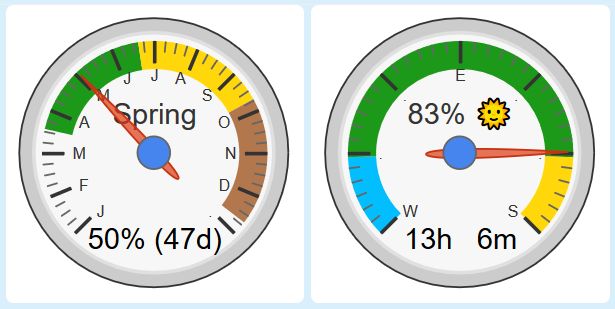
If it helps, here is my latest snippet for my gauge: (using the ‘Value’ field)
[chart-gauge min=0 max=100 greenFrom=0 greenTo=16 greenColor={colorWin} yellowFrom=16 yellowTo=84 yellowColor={colorYel} redFrom=84 redTo=100 redColor={colorSum} minorTicks=6 majorTicks=W…E…S|{dlpR}%  ]
]
{colorWin} and {colorSum} are static, while
{colorYel} changes based on what day of the year it is… Something like:
(isBetween(doy,172,356) ? 'colorFall' : 'colorSpring')
{dlpR} is actually {dlp} rounded…
isBetween(dlp,1,99) ? round(dlp,1) : round(dlp,2)
It shows a single decimal most of the year, but two decimals from 0-1% and 99-100%.
Let me know @Koyfam if you need any help setting this up…
It is definitely one of my favorite pistons…
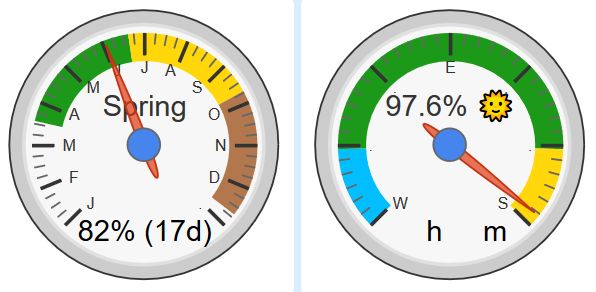
(the references above are for the right gauge… with time removed for privacy)
![]()



 ]
]
