Gauge for Length of Day (showing Solstices & Equinoxes)


#172

Note to self:

In reference to the “pendulum” analogy above, it might be worth researching to see if Google’s gauges can be drawn upside down.

pic

It would make the speed changes from the dial look 100% natural.
(although I’d probably flip Summer & Winter)


#173

I find this gauge very interesting. So, I am logging the length of day calculation data to google sheets and I find this plot interesting. For a while after the solstice, the sunrise and sunset times are both moving in the same direction but at different speeds as the day shortens. Unfortunately, I didn’t start logging actual sunset/sunrise times until after the solstice. Looking forward to getting more data filled in.

Sunrise%20and%20Sunset


#174

Yeah, this is cool…

How long depends on our latitude, but for me:

  • about 2 weeks before the Summer Solstice, the Sunrise starts increasing
  • about 2 weeks after the Summer Solstice, the Sunset starts dropping

(the dlp% in between is usually 99% or greater, with them cancelling each other out, mostly)


The light blue line represents the Summer Solstice. For the really observant, notice how that line is the longest vertical line possible in the “blue-zone” (which represents dayLength).


During the Winter Solstice, the shifting times are inverted…


#175

Perhaps it’s easier to see in this example. All 7 lines are the same length.
(representing the longest day of the year)

… or zoomed in here:

pic


#176

Nice graphics. Really shows what is going on. The dynamics of the earth tilt, sun, etc, make this all very fascinating. Fun to see how it plays out in real life.


#177

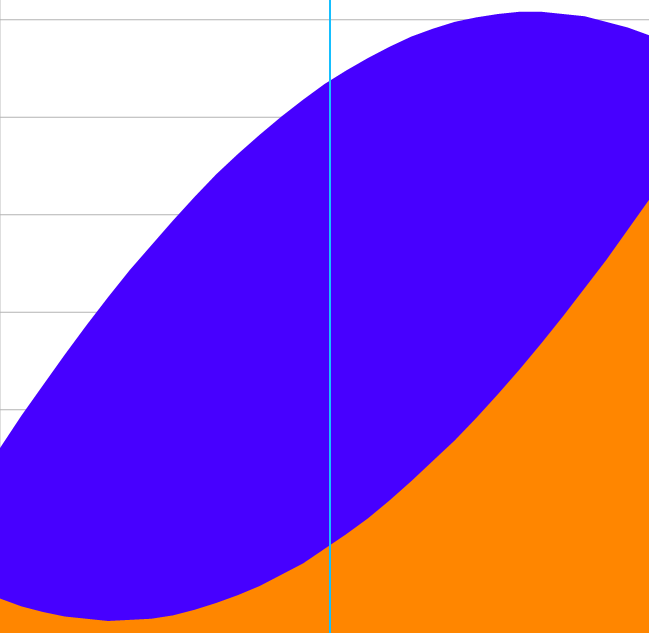
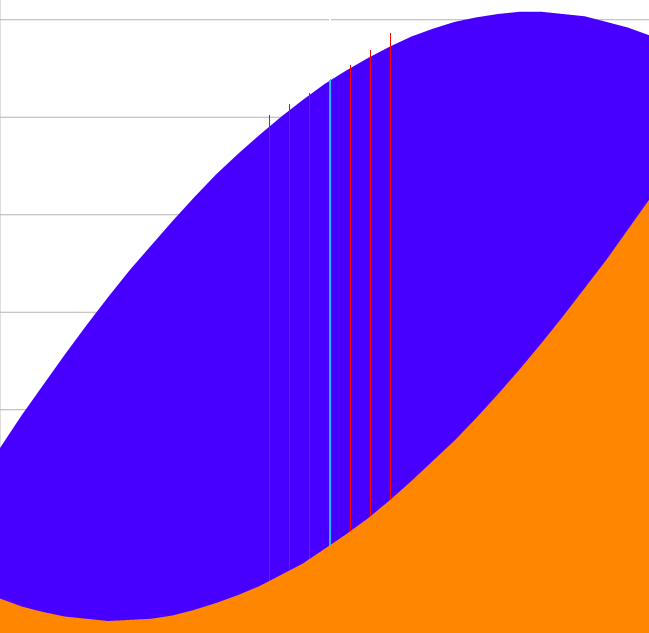
I like how this clearly shows how the Solstice is not an actual day, (as we were taught in school) but a split moment in time. (it could happen any hour, day or night)

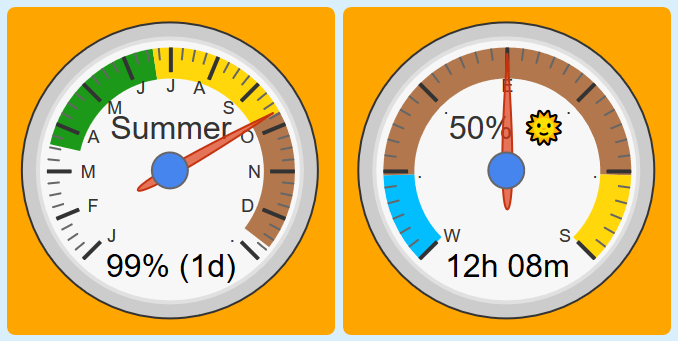
So, for example, if the Summer Solstice was at midnight, then there would actually be two days in a row at equal dayLengths. (with a dlp% not quite hitting 100% that year)

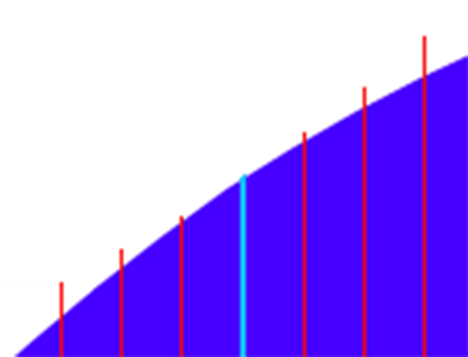
Likewise, if the Summer Solstice is at noon, then that day should be the absolute longest possible for that location… (and if we extend that logic, the day before & after should match each other) Heck, on this rare event, I bet the week before will mirror the week after as well.

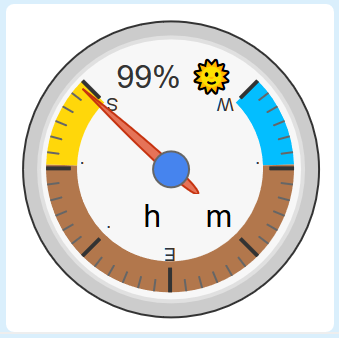
Of course, 99% of the time, the Solstice is on a sliding scale somewhere in between noon & midnight, so take these extremes with a grain of salt.


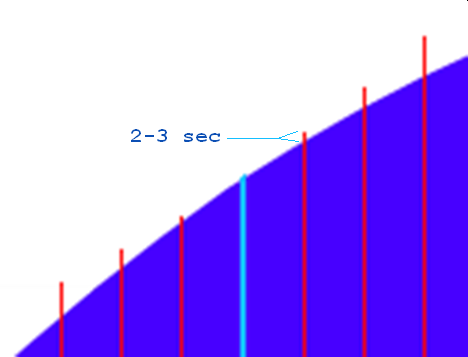
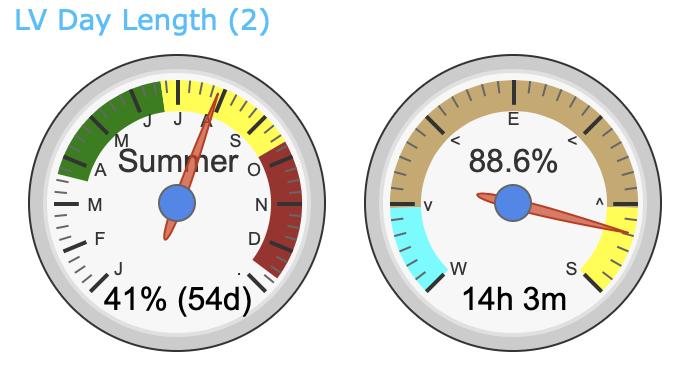
For those just joining us, I should probably mention that even with a 24 hour variance, the final dayLength should be within about two seconds of any other year.

pic


#178

And, this sliding scale is driven by a combination of the uneven length of the year (~365.25 days but not exactly) and the leap years.


#179

You could say it that way… but I look at it like this:
The length of a year is very stable… but
it is not evenly divisible by what we consider hours, minutes or seconds…

So our definition of hours, minutes and seconds do not align perfectly with a real year.
(and of course, we are stubborn creatures, who want the universe to align with our expectations)

Now we could add 57.3 seconds to the length of each day (totaling up to 5.8 hrs a year) to totally bypass the leap years… but it would not take long before the 9-5 workers were working the graveyard shift, LOL


#180

A question for you. I currently have these two gauges:

They are in separate pistons but both trigger off changes in global variable @daylengthpercent. Should I merge these two pistons to avoid two pistons triggering simultaneously or are these small enough they don’t matter? thanks.

EDIT: I am asking because I am going to add a moon phase gauge also and wondering if I should put all three in one piston.


#181

I would only trigger one piston off of the @global change… and then daisy chain from there.
(IE: your last command in piston 1 can execute piston 2)

This works well for pistons with this up top:

… and keeps them from stepping on each other’s toes.


#182

Appreciate the tip. Will see how it works overall tonight. Here is my first cut at the moon phase gauge. Need to work on the colors, I think. Also might find some icons rather than lettering for the divisions.

42%20PM

Planning to monitor this for a little bit. Have to use forecast data for moonrise and moonset. Interesting observation while working on this is the forecast and conditions data for today’s sunrise are not the same. Seems weird they would be different.


#183

All 8 major moon icons can be found here in the section titled “Sky & Weather”.
(they definitely work in Google gauges as a header or footer, but untested as a majorTick)


Can you elaborate? What two data points are you comparing?


split this topic #184

5 posts were split to a new topic: TWC - Sunrise/Set - Forecast & conditions slightly different


#185

Whoops… Yesterday was the half-way point for Summer…

Here are my gauges today:

pic


When referring to the “length of day”, we now begin the mid-quarter (Goldilocks) time period for the next 3 months. (meaning the days are neither too long or short)

Mathematically speaking, (depending on latitude), approx 83% > 17% is a quarter year.
(the day’s length changes the most dramatically during this quarter)

I like to think of the dial on the right as kind of like the dial on my oven… As Mother Nature turns the dial slowly downwards, (less sunlight), it begins to allow the air to cool off more and more…

Eventually, I plan on creating a similar gauge right next to this one that monitors the heat throughout the year. I think it’d be “cool” to see where we are along that timeline as well. :sunglasses: :tropical_drink:


#186

My daylight appears to be tracking your gauge but my days seems to be off. I also added the moon phase to this display for fun.

Will have to take a look when I get the chance. I think all my first day of season calls use the 21st of the appropriate month. Also, there is no accounting for the leap day this year except in the ‘daysThisYear’ calculation.


#187

Without access to a local API, late 20 or early 21 is likely the best number, statistically speaking.
(At it’s worst, it should be within 98.5% accuracy for all future Solstices & Equinoxes. IE: 1½ days)

My numbers will not match yours because I am pulling data from a custom file I created.


For me, this Fall Equinox falls on the 22nd:

pic

… and my Summer Solstice was on the 20th.
(My math is based on the difference)


#188

Does this percentage mean that tomorrow will no longer be “hot as hell”…?

pic


Apparently not… Looking at the temperature 24 hours later…

pic

… we are only 6 degrees shy of our record high… :fire:


API with avg/record high & low for today at my location?
#189

We are about 9 hours away from the Fall Equinox…

pic


For those curious about the extra 8 min… :arrow_upper_right:

For the truly equal day/night split, we’ll have to wait a few days after the official equinox.
(The equilux varies for all of us, based on latitude)

For a summary of that link, basically the 8 min for my location is about:

  • 2.7 min due to the time it takes the radius to cross the horizon twice
    (Equinox is based on the center point, and sunrise/set is based on the outer edge)

  • 5.4 min due to the light refracting
    (atmospheric refraction advances the sunrise and delays the sunset)


#190

… and 24 hours later, with change-over…

pic


#191

I missed th first day of fall as we were on a road trip at the time. I need to wait until December to get my true shortest day of the year to fix my scales. Right now, it already says 47.8% at 12h 2m day length. It is funny, you would think the 2 hour day would be the middle between longest and shortest day and be 50% but that doesn’t even appear to be the case for you and your data is abut as close to accurate as you can get, I think.